
Page 104 - AIH-1-3
P. 104
Artificial Intelligence in Health ISM: A new multi-view space-learning model
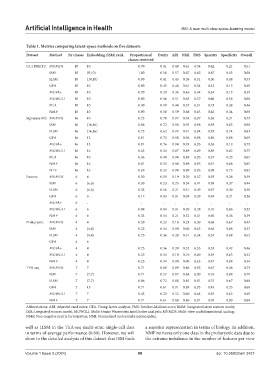
Table 1. Metrics comparing latent‑space methods on five datasets
Dataset Method Nr classes Embedding (ISM) rank Proportion of Purity ARI NMI FMS Sparsity Specificity Overall
classes retrieved
UCI DIGITS MVMDS 10 10 0.70 0.41 0.49 0.61 0.54 0.62 0.21 0.51
ISM 10 (9,10) 1.00 0.58 0.57 0.67 0.62 0.87 0.43 0.68
ILSM 10 (10,10) 0.80 0.41 0.45 0.58 0.51 0.50 0.48 0.53
GFA 10 10 0.90 0.45 0.48 0.61 0.54 0.32 0.15 0.49
MOFA+ 10 10 0.70 0.29 0.36 0.46 0.44 0.34 0.13 0.39
MOWGLI 10 10 0.80 0.46 0.51 0.65 0.57 0.60 0.58 0.60
PCA 10 10 0.40 0.19 0.44 0.57 0.51 0.73 0.38 0.46
NMF 10 10 0.90 0.58 0.59 0.68 0.63 0.46 0.34 0.60
Signature 915 MVMDS 16 10 0.75 0.70 0.97 0.95 0.97 0.56 0.21 0.73
ISM 16 (16,16) 0.88 0.72 0.98 0.95 0.98 0.93 0.83 0.90
ILSM 16 (16,16) 0.75 0.62 0.93 0.91 0.94 0.93 0.74 0.83
GFA 16 12 0.81 0.73 0.98 0.96 0.98 0.30 0.08 0.69
MOFA+ 16 13 0.81 0.76 0.94 0.93 0.95 0.56 0.19 0.73
MOWGLI 16 16 0.63 0.44 0.87 0.89 0.89 0.89 0.82 0.77
PCA 16 10 0.56 0.40 0.94 0.89 0.95 0.57 0.23 0.65
NMF 16 16 0.81 0.55 0.94 0.89 0.95 0.91 0.88 0.85
NTF 16 16 0.69 0.52 0.94 0.89 0.95 0.98 0.75 0.82
Reuters MVMDS 6 4 0.50 0.19 0.19 0.30 0.37 0.93 0.28 0.39
ISM 6 (6,6) 0.50 0.23 0.25 0.34 0.41 0.98 0.37 0.44
ILSM 6 (6,6) 0.33 0.16 0.21 0.31 0.39 0.97 0.30 0.38
GFA 6 3 0.17 0.03 0.01 0.09 0.39 0.94 0.21 0.26
MOFA+ 6 - - - - - - - - -
MOWGLI 6 6 0.08 0.04 0.01 0.20 0.28 0.10 0.86 0.22
NMF 6 6 0.33 0.14 0.21 0.32 0.41 0.96 0.36 0.39
Prokaryotic MVMDS 4 4 0.50 0.22 0.18 0.23 0.50 0.68 0.67 0.43
ISM 4 (4,4) 0.25 0.14 0.00 0.00 0.63 0.66 0.88 0.37
ILSM 4 (4,4) 0.75 0.36 0.28 0.31 0.54 0.55 0.88 0.52
GFA 4 6 - - - - - - - -
MOFA+ 4 4 0.75 0.36 0.29 0.32 0.55 0.53 0.42 0.46
MOWGLI 4 4 0.25 0.14 0.10 0.10 0.60 0.39 0.63 0.32
NMF 4 4 0.25 0.14 0.00 0.00 0.63 0.47 0.88 0.34
TEA-seq MVMDS 7 7 0.71 0.60 0.89 0.86 0.92 0.67 0.48 0.73
ISM 7 (7,7) 0.71 0.57 0.87 0.84 0.90 0.76 0.88 0.79
ILSM 7 (7,7) 0.86 0.72 0.88 0.85 0.91 0.75 0.67 0.80
GFA 7 15 0.71 0.61 0.91 0.89 0.93 0.45 0.25 0.68
MOWGLI 7 7 0.43 0.23 0.52 0.60 0.64 0.39 0.62 0.49
NMF 7 7 0.71 0.61 0.88 0.86 0.91 0.70 0.90 0.80
Abbreviations: ARI: Adjusted rand index; GFA: Group factor analysis; FMS: Fowlkes-Mallows score; ILSM: Integrated latent sources model;
ISM: Integrated sources model; MOWGLI: Multi-Omics Wasserstein inteGrative anaLysIs; MVMDS: Multi-view multidimensional scaling;
NMF: Non-negative matrix factorization; NMI: Normalized mutual information index.
well as ILSM in the TEA-seq multi-omic single-cell data a superior representation in terms of biology. In addition,
in terms of average performance (0.80). However, we will NMF retrieves only one class in the prokaryotic data due to
show in the detailed analysis of this dataset that ISM finds the extreme imbalance in the number of features per view
Volume 1 Issue 3 (2024) 98 doi: 10.36922/aih.3427