
Page 109 - AIH-1-3
P. 109
Artificial Intelligence in Health ISM: A new multi-view space-learning model
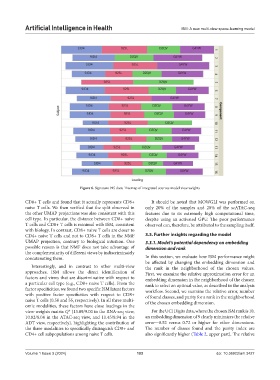
Figure 6. Signature 915 data: Treemap of integrated sources model view weights
CD8+ T cells and found that it actually represents CD8+ It should be noted that MOWGLI was performed on
naive T cells. We then verified that the split observed in only 20% of the samples and 20% of the scATAC-seq
the other UMAP projections was also consistent with this features due to its extremely high computational time,
cell type. In particular, the distance between CD8+ naive despite using an activated GPU. The poor performance
T cells and CD8+ T cells is minimal with ISM, consistent observed can, therefore, be attributed to the sampling itself.
with biology. In contrast, CD8+ naive T cells are closer to
CD4+ naive T cells and not to CD8+ T cells in the NMF 3.3. Further insights regarding the model
UMAP projection, contrary to biological intuition. One 3.3.1. Model’s potential dependency on embedding
possible reason is that NMF does not take advantage of dimension and rank
the complementarity of different views by indiscriminately
concatenating them. In this section, we evaluate how ISM performance might
be affected by changing the embedding dimension and
Interestingly, and in contrast to other multi-view the rank in the neighborhood of the chosen values.
approaches, ISM allows the direct identification of First, we examine the relative approximation error for an
factors and views that are discriminative with respect to embedding dimension in the neighborhood of the chosen
a particular cell type (e.g., CD8+ naive T cells). From the rank to select an optimal value, as described in the analysis
factor specificities, we found two specific ISM latent factors workflow. Second, we examine the relative error, number
with positive factor specificities with respect to CD8+ of found classes, and purity for a rank in the neighborhood
naive T cells (0.50 and 55, respectively). In all three multi- of the chosen embedding dimension.
omic modalities, these factors have close loadings in the
view-weights matrix Q* (13.09/9.00 in the RNA-seq view, For the UCI Digits data, where the chosen ISM rank is 10,
10.82/8.04 in the ATAC-seq view, and 11.45/8.94 in the an embedding dimension of 9 clearly minimizes the relative
ADT view, respectively), highlighting the contribution of error—0.52 versus 0.72 or higher for other dimensions.
the three modalities to specifically distinguish CD8+ and The number of classes found and the purity index are
CD4+ cell subpopulations among naive T cells. also significantly higher (Table 2, upper part). The relative
Volume 1 Issue 3 (2024) 103 doi: 10.36922/aih.3427