
Page 113 - AIH-1-3
P. 113
Artificial Intelligence in Health ISM: A new multi-view space-learning model
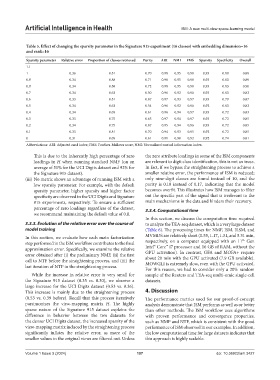
Table 5. Effect of changing the sparsity parameter in the Signature 915 experiment (16 classes) with embedding dimension=16
and rank=16
Sparsity parameter Relative error Proportion of classes retrieved Purity ARI NMI FMS Sparsity Specificity Overall
1.1 - - - - - - - - -
1 0.36 0.81 0.70 0.98 0.95 0.98 0.93 0.80 0.88
0.9 0.34 0.88 0.71 0.98 0.95 0.98 0.93 0.83 0.89
0.8 0.34 0.88 0.72 0.98 0.95 0.98 0.93 0.83 0.90
0.7 0.34 0.63 0.50 0.96 0.92 0.96 0.93 0.83 0.82
0.6 0.33 0.81 0.67 0.97 0.93 0.97 0.93 0.79 0.87
0.5 0.34 0.63 0.54 0.96 0.92 0.96 0.92 0.83 0.82
0.4 0.34 0.69 0.61 0.96 0.94 0.97 0.93 0.72 0.83
0.3 0.33 0.75 0.65 0.97 0.94 0.97 0.93 0.72 0.85
0.2 0.34 0.75 0.67 0.95 0.94 0.96 0.93 0.72 0.85
0.1 0.33 0.81 0.70 0.94 0.93 0.95 0.92 0.72 0.85
0 0.31 0.69 0.61 0.91 0.90 0.92 0.92 0.74 0.81
Abbreviations: ARI: Adjusted rand index; FMS: Fowlkes-Mallows score; NMI: Normalized mutual information index.
This is due to the inherently high percentage of zero the zero attribute loadings in some of the ISM components
loadings in H when running standard NMF (on an are relevant to digit class identification, this is not an issue.
average of 51% for the UCI Digits dataset and 92% for In fact, if we bypass the straightening process to achieve a
the Signature 915 dataset). smaller relative error, the performance of ISM is reduced;
(iii) No metric shows an advantage of running ISM with a only nine-digit classes are found instead of 10, and the
low sparsity parameter. For example, with the default purity is 0.18 instead of 0.17, indicating that the model
sparsity parameter, higher sparsity and higher factor becomes overfit. This illustrates how ISM manages to filter
specificity are observed in the UCI Digits and Signature out the specific part of the signal that is irrelevant to the
915 experiments, respectively. To ensure a sufficient main mechanisms in the data and hinders their recovery.
percentage of zero loadings regardless of the dataset, 3.3.4. Computational time
we recommend maintaining the default value of 0.8.
In this section, we discuss the computation time required
3.3.3. Evolution of the relative error over the course of to analyze the TEA-seq dataset, which is a very large dataset
model training (Table 6). The processing times for NMF, ISM, ILSM, and
In this section, we evaluate how each main factorization MVMDS are relatively short (0.55, 1.17, 1.31, and 5.31 min,
th
step performed in the ISM workflow contributes to the final respectively, on a computer equipped with an 11 Gen
approximation error. Specifically, we examine the relative Intel® Core™ i7 processor and 16 GB of RAM, without the
error obtained after (i) the preliminary NMF, (ii) the first GPU activation). In contrast, GFA and MOFA+ require
call to NTF before the straightening process, and (iii) the about 20 min with the GPU activated (7.9 GB available).
last iteration of NTF in the straightening process. MOWGLI is extremely slow, even with the GPU activated.
For this reason, we had to consider only a 20% random
While the increase in relative error is very small for sample of the Reuters and TEA-seq multi-omic single-cell
the Signature 915 dataset (0.35 vs. 0.30), we observe a datasets.
large increase for the UCI Digits dataset (0.53 vs. 0.36).
This increase is mainly due to the straightening process 4. Discussion
(0.53 vs. 0.39 before). Recall that this process iteratively The performance metrics used for our proof-of-concept
parsimonizes the view-mapping matrix H. The highly analysis demonstrate that ISM performs as well as or better
sparse nature of the Signature 915 dataset explains the than other methods. The ISM workflow uses algorithms
difference in behavior between the two datasets: for with proven performance and convergence properties,
the denser UCI Digits dataset, the increased sparsity of the such as NMF and NTF, which is consistent with the good
view-mapping matrix induced by the straightening process performance of ISM observed in our examples. In addition,
significantly inflates the relative error, as more of the the low computational time for large datasets indicates that
smaller values in the original views are filtered out. Unless this approach is highly scalable.
Volume 1 Issue 3 (2024) 107 doi: 10.36922/aih.3427