
Page 112 - AIH-1-3
P. 112
Artificial Intelligence in Health ISM: A new multi-view space-learning model
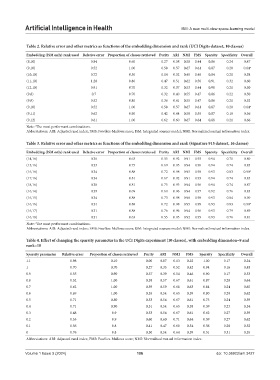
Table 2. Relative error and other metrics as functions of the embedding dimension and rank (UCI Digits dataset, 10 classes)
Embedding (ISM only) rank used Relative error Proportion of classes retrieved Purity ARI NMI FMS Sparsity Specificity Overall
(8,10) 0.84 0.60 0.27 0.38 0.50 0.44 0.86 0.24 0.47
(9,10) 0.52 1.00 0.58 0.57 0.67 0.61 0.87 0.20 0.64 a
(10,10) 0.72 0.30 0.14 0.32 0.45 0.40 0.84 0.20 0.38
(11,10) 1.20 0.80 0.47 0.51 0.62 0.56 0.91 0.32 0.60
(12,10) 0.91 0.70 0.32 0.37 0.53 0.44 0.90 0.21 0.50
(9,8) 0.7 0.70 0.32 0.40 0.55 0.47 0.86 0.22 0.50
(9,9) 0.52 0.80 0.36 0.41 0.55 0.47 0.86 0.21 0.52
(9,10) 0.52 1.00 0.58 0.57 0.67 0.61 0.87 0.20 0.64 a
(9,11) 0.62 0.90 0.42 0.44 0.58 0.50 0.87 0.19 0.56
(9,12) 0.61 1.00 0.62 0.60 0.67 0.64 0.88 0.21 0.66
Note: The most performant combinations.
a
Abbreviations: ARI: Adjusted rand index; FMS: Fowlkes-Mallows score; ISM: Integrated sources model; NMI: Normalized mutual information index.
Table 3. Relative error and other metrics as functions of the embedding dimension and rank (Signature 915 dataset, 16 classes)
Embedding (ISM only) rank used Relative error Proportion of classes retrieved Purity ARI NMI FMS Sparsity Specificity Overall
(14,16) 0.36 0.63 0.55 0.92 0.91 0.93 0.94 0.70 0.80
(15,16) 0.33 0.75 0.69 0.95 0.94 0.96 0.94 0.74 0.85
(16,16) 0.34 0.88 0.72 0.98 0.95 0.98 0.93 0.83 0.90 a
(17,16) 0.34 0.81 0.67 0.92 0.91 0.93 0.94 0.74 0.85
(18,16) 0.38 0.81 0.75 0.95 0.94 0.96 0.94 0.74 0.87
(16,14) 0.39 0.69 0.60 0.96 0.94 0.97 0.92 0.76 0.83
(16,15) 0.34 0.88 0.73 0.98 0.96 0.98 0.93 0.84 0.90
(16,16) 0.34 0.88 0.72 0.98 0.95 0.98 0.93 0.83 0.90 a
(16,17) 0.31 0.88 0.76 0.96 0.94 0.96 0.93 0.79 0.89
(16,18) 0.31 0.63 0.55 0.95 0.92 0.95 0.93 0.76 0.81
Note: The most performant combinations.
a
Abbreviations: ARI: Adjusted rand index; FMS: Fowlkes-Mallows score; ISM: Integrated sources model; NMI: Normalized mutual information index.
Table 4. Effect of changing the sparsity parameter in the UCI Digits experiment (10 classes), with embedding dimension=9 and
rank=10
Sparsity parameter Relative error Proportion of classes retrieved Purity ARI NMI FMS Sparsity Specificity Overall
1.1 0.98 0.10 0.00 0.07 0.13 0.22 1.00 0.17 0.24
1 0.70 0.70 0.27 0.35 0.52 0.42 0.94 0.16 0.48
0.9 0.55 0.90 0.37 0.39 0.54 0.46 0.90 0.17 0.53
0.8 0.52 1.00 0.58 0.57 0.67 0.61 0.87 0.20 0.64
0.7 0.62 1.00 0.59 0.59 0.68 0.63 0.84 0.24 0.65
0.6 0.69 1.00 0.55 0.54 0.65 0.59 0.80 0.20 0.62
0.5 0.71 0.80 0.53 0.56 0.67 0.61 0.73 0.24 0.59
0.4 0.71 0.90 0.51 0.54 0.65 0.58 0.39 0.23 0.54
0.3 0.48 0.9 0.53 0.56 0.67 0.61 0.62 0.27 0.59
0.2 0.53 0.9 0.60 0.60 0.71 0.64 0.59 0.27 0.62
0.1 0.56 0.8 0.41 0.47 0.60 0.54 0.56 0.28 0.52
0 0.76 0.8 0.50 0.54 0.64 0.59 0.51 0.31 0.55
Abbreviations: ARI: Adjusted rand index; FMS: Fowlkes-Mallows score; NMI: Normalized mutual information index.
Volume 1 Issue 3 (2024) 106 doi: 10.36922/aih.3427