
Page 115 - AIH-1-4
P. 115
Artificial Intelligence in Health Complex early diagnosis of MS through machine learning
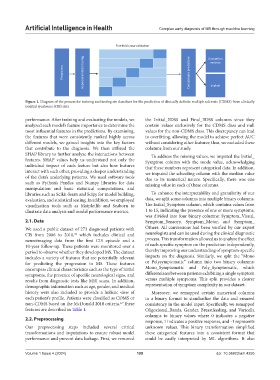
Five-fold cross-validaon Evaluaon
Preprocess Hyperparameters tuning Concatenate predicons metrics
Explain
Figure 1. Diagram of the process for training and testing six classifiers for the prediction of clinically definite multiple sclerosis (CDMS) from clinically
isolated syndrome (CIS) data
performance. After training and evaluating the models, we the Initial_EDSS and Final_EDSS columns since they
analyzed each model’s feature importance to determine the contain values exclusively for the CDMS class and null
most influential features in the predictions. By examining, values for the non-CDMS class. This discrepancy can lead
the features that were consistently ranked highly across to overfitting, allowing the model to achieve perfect AUC
different models, we gained insights into the key factors without considering other features; thus, we excluded these
that contribute to the diagnosis. We then utilized the columns from our study.
SHAP library to further analyze the interactions between To address the missing values, we imputed the Initial_
features. SHAP values help us understand not only the Symptom column with the mode value, acknowledging
individual impact of each feature but also how features that these numbers represent categorical data. In addition,
interact with each other, providing a deeper understanding we imputed the schooling column with the median value
of the data’s underlying patterns. We used software tools due to its numerical nature. Specifically, there was one
such as Python’s Pandas and Numpy libraries for data missing value in each of these columns.
manipulation and basic statistical computations, and
libraries such as Scikit-learn and Scipy for model building, To enhance the interpretability and granularity of our
evaluation, and statistical testing. In addition, we employed data, we split some columns into multiple binary columns.
visualization tools such as Matplotlib and Seaborn to The Initial_Symptom column, which contains values from
illustrate data analysis and model performance metrics. 1 to 15, indicating the presence of one or more symptoms,
was divided into four binary columns: Symptom_Visual,
2.1. Data Symptom_Sensory, Symptom_Motor, and Symptom_
We used a public dataset of 273 diagnosed patients with Others. All conversions had been verified by our expert
CIS from 2006 to 2010, which includes clinical and neurologists and can be used during the clinical diagnostic
52
neuroimaging data from the first CIS episode and a process. This transformation allowed us to analyze the effect
10-year follow-up. These patients were monitored over a of each specific symptom on the prediction independently,
period to observe whether they developed MS. The dataset thereby improving our understanding of symptom-specific
includes a variety of features that are potentially relevant impacts on the diagnosis. Similarly, we split the “Mono
for predicting the progression to MS. These features or Polysymptomatic” column into two binary columns:
encompass clinical characteristics such as the type of initial Mono_Symptomatic and Poly_Symptomatic, which
symptoms, the presence of specific neurological signs, and differentiates between patients exhibiting a single symptom
results from diagnostic tests like MRI scans. In addition, versus multiple symptoms. This split provides a clearer
demographic information such as age, gender, and medical representation of symptom complexity in our dataset.
history were also included to provide a holistic view of Moreover, we remapped certain numerical columns
each patient’s profile. Patients were classified as CDMS or to a binary format to standardize the data and ensured
non-CDMS based on the McDonald 2010 criteria. These consistency in the model input. Specifically, we remapped
12
features are described in Table 1. Oligoclonal_Bands, Gender, Breastfeeding, and Varicella
columns to binary values where 0 indicates a negative
2.2. Preprocessing response, 1 indicates a positive response, and -1 represents
Our preprocessing steps included several critical unknown values. This binary transformation simplified
transformations and imputations to ensure robust model these categorical features into a consistent format that
performance and prevent data leakage. First, we removed could be easily interpreted by ML algorithms. It also
Volume 1 Issue 4 (2024) 109 doi: 10.36922/aih.4255