
Page 71 - AIH-1-4
P. 71
Artificial Intelligence in Health ML models for heartbeat classification
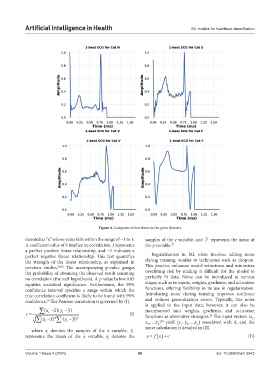
Figure 4. Categories of heartbeats in the given datasets
denoted as “r,” whose value falls within the range of −1 to 1. samples of the y variable, and y represents the mean of
A coefficient value of 0 implies no correlation, 1 represents the y variable. 27
a perfect positive linear relationship, and −1 indicates a
perfect negative linear relationship. This test quantifies Regularization in ML often involves adding noise
the strength of the linear relationship, as explained in during training, similar to techniques such as dropout.
previous studies. 24,25 The accompanying p-value gauges This practice enhances model robustness and minimizes
the probability of obtaining the observed result assuming overfitting risk by making it difficult for the model to
no correlation (the null hypothesis). A p-value below 0.05 perfectly fit data. Noise can be introduced at various
signifies statistical significance. Furthermore, the 95% stages, such as in inputs, weights, gradients, and activation
confidence interval specifies a range within which the functions, offering flexibility in its use in regularization.
true correlation coefficient is likely to be found with 95% Introducing noise during training improves resilience
confidence. The Pearson correlation is governed by (I). and reduces generalization errors. Typically, this noise
26
is applied to the input data; however, it can also be
∑ ( – )( – ) x xy y incorporated into weights, gradients, and activation
r = i i (I) functions as alternative strategies. The input vectors {x ,
28
∑ ( – )²x i x ∑ ( – )²y i y x ,…,x } yield {y , y ,…,y } associated with it, and the
1
18
n
2
n
1
2
noise calculation is detailed in (II).
where x denotes the samples of the x variable, x
i
represents the mean of the x variable, y denotes the y = fx (II)
( ) ε+
i
Volume 1 Issue 4 (2024) 65 doi: 10.36922/aih.3543