
Page 72 - AIH-1-4
P. 72
Artificial Intelligence in Health ML models for heartbeat classification
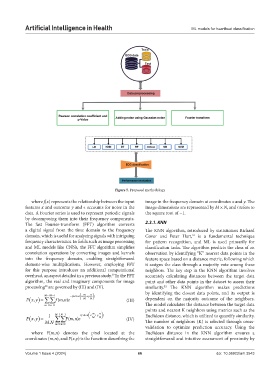
Figure 5. Proposed methodology
where f(x) represents the relationship between the input image in the frequency domain at coordinates x and y. The
features x and outcome y and ϵ accounts for noise in the image dimensions are represented by M × N, and i refers to
data. A Fourier series is used to represent periodic signals the square root of −1.
by decomposing them into their frequency components.
The fast Fourier-transform (FFT) algorithm converts 2.3.1. KNN
a digital signal from the time domain to the frequency The KNN algorithm, introduced by statisticians Richard
domain, which is useful for analyzing signals with intriguing Cover and Peter Hart, is a fundamental technique
31
frequency characteristics. In fields such as image processing for pattern recognition, and ML is used primarily for
and ML models like CNNs, the FFT algorithm simplifies classification tasks. The algorithm predicts the class of an
convolution operations by converting images and kernels observation by identifying “K” nearest data points in the
into the frequency domain, enabling straightforward feature space based on a distance metric, following which
element-wise multiplications. However, employing FFT it assigns the class through a majority vote among these
for this purpose introduces an additional computational neighbors. The key step in the KNN algorithm involves
overhead, an aspect detailed in a previous study. In the FFT accurately calculating distances between the target data
29
algorithm, the real and imaginary components for image point and other data points in the dataset to assess their
processing are governed by (III) and (IV). similarity. The KNN algorithm makes predictions
30
32
by identifying the closest data points, and its output is
M− 1N − 1 − (2i×× π x m + y n )
) ∑∑
F ( ,x y = f ( ,)mn e M N (III) dependent on the majority outcome of the neighbors.
m= 0 n= 0 The model calculates the distance between the target data
points and nearest K neighbors using metrics such as the
m
n
1N −
)
F ( , x y = 1 M− ∑∑ 1 F mn (2i×× π x M + y N ) (IV) Euclidean distance, which is utilized to quantify similarity.
( ,)e
MN m= 0 n= 0 The number of neighbors (K) is selected through cross-
.
validation to optimize prediction accuracy. Using the
where F(m,n) denotes the pixel located at the Euclidean distance in the KNN algorithm ensures a
coordinates (m,n), and F(x,y) is the function describing the straightforward and intuitive assessment of proximity by
Volume 1 Issue 4 (2024) 66 doi: 10.36922/aih.3543