
Page 74 - AIH-1-4
P. 74
Artificial Intelligence in Health ML models for heartbeat classification
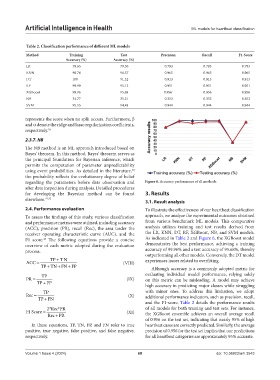
Table 2. Classification performance of different ML models
Method Training Test Precision Recall F1‑Score
Accuracy (%) Accuracy (%)
LR 79.65 79.30 0.793 0.793 0.793
KNN 98.74 96.57 0.965 0.965 0.965
DT 100 91.32 0.913 0.913 0.913
RF 99.99 95.12 0.951 0.951 0.951
XGBoost 99.96 95.68 0.956` 0.956 0.956
NB 34.77 35.21 0.352 0.352 0.352
SVM 95.55 94.48 0.944 0.944 0.944
represents the score when no split occurs. Furthermore, β
and α denote the ridge and lasso regularization coefficients,
respectively. 39
2.3.7. NB
The NB method is an ML approach introduced based on
Bayes’ theorem. In this method, Bayes’ theorem serves as
the principal foundation for Bayesian inference, which
permits the computation of parameter unpredictability
using event probabilities. As detailed in the literature,
40
the probability reflects the evolutionary degree of belief
regarding the parameters before data observation and Figure 6. Accuracy performance of all methods
after data inspection during analysis. Detailed procedures
for developing the Bayesian method can be found 3. Results
elsewhere. 41,42 3.1. Result analysis
2.4. Performance evaluation To illustrate the effectiveness of our heartbeat classification
To assess the findings of this study, various classification approach, we analyze the experimental outcomes obtained
and performance metrics were utilized, including accuracy from various benchmark ML models. This comparative
(ACC), precision (PR), recall (Rec), the area under the analysis utilizes training and test results derived from
receiver operating characteristic curve (AUC), and the the LR, KNN, DT, RF, XGBoost, NB, and SVM models.
F1 score. The following equations provide a concise As indicated in Table 2 and Figure 6, the XGBoost model
43
overview of each metric adopted during the evaluation demonstrates the best performance, achieving a training
process. accuracy of 99.96% and a test accuracy of 95.68%, thereby
outperforming all other models. Conversely, the DT model
TP T N+ experiences issues related to overfitting.
ACC = (VIII)
TP TN FN FP+ + + Although accuracy is a commonly adopted metric for
TP evaluating individual model performance, relying solely
PR = (IX) on this metric can be misleading. A model may achieve
TP FP+
high accuracy in predicting major classes while struggling
TP with minor ones. To address this limitation, we adopt
Rec = (X) additional performance indicators, such as precision, recall,
+
TP FN
and the F1-score. Table 2 details the performance results
2*Rec*PR of all models for both training and test sets. For instance,
F1 Score = (XI) the XGBoost ensemble achieves an overall average recall
Rec PR+
of 0.956 on the test set, indicating that nearly 95% of high
In these equations, TP, TN, FP, and FN refer to true heartbeat cases are correctly predicted. Similarly, the average
positive, true negative, false positive, and false negative, precision of 0.956 for the test set implies that our predictions
respectively. for all heartbeat categories are approximately 95% accurate.
Volume 1 Issue 4 (2024) 68 doi: 10.36922/aih.3543