
Page 62 - AIH-2-1
P. 62
Artificial Intelligence in Health Algorithm and metal oxide nanoparticle in MRI
A B
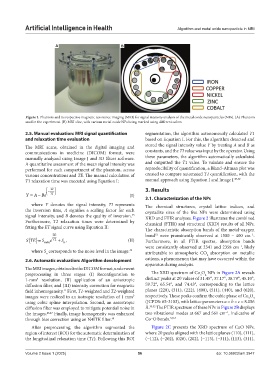
Figure 1. Phantom and its respective magnetic resonance imaging (MRI) for signal intensity analysis of the metal oxide nanoparticles (NPs). (A) Phantom
used in the experiment. (B) MRI slice, with various metal oxide NPs being marked using different colors
2.5. Manual evaluation: MRI signal quantification segmentation, the algorithm autonomously calculated T1
and relaxation time evaluation based on Equation I. For this, the algorithm detected and
The MRI scans, obtained in the digital imaging and stored the signal intensity value Y by treating A and B as
communications in medicine (DICOM) format, were constants, and the TI value was input by the operator. Using
manually analyzed using Image J and 3D Slicer software. these parameters, the algorithm automatically calculated
A quantitative assessment of the mean signal intensity was and outputted the T1 value. To validate and ensure the
performed for each compartment of the phantom, across reproducibility of quantification, a Bland‒Altman plot was
various concentrations and TE. The manual calculation of created to compare automated T1 quantification, with the
T1 relaxation time was executed using Equation I: manual approach using Equation I and Image J. 49,50
− TI 3. Results
Y = A Be− 1 T (I)
3.1. Characterization of the NPs
where Y denotes the signal intensity, TI represents The chemical structures, crystal lattice indices, and
the inversion time, A signifies a scaling factor for each crystallite sizes of the five NPs were determined using
signal intensity, and B denotes the quality of inversion. XRD and FTIR analyses. Figure 2 illustrates the combined
45
Furthermore, T2 relaxation times were determined by chemical (FTIR) and structural (XRD) results of all NPs.
fitting the ET signal curve using Equation II:
The characteristic absorption bands of the metal‒oxygen
TE bond were prominently observed at 1500 – 400 cm .
−1
51
S ( ) =TE S máx e T 2 + S , (II) Furthermore, in all FTIR spectra, absorption bands
n
were consistently observed at 2341 and 2358 cm , likely
−1
where S corresponds to the noise level in the image. 45
n attributable to atmospheric CO absorption on metallic
2
2.6. Automatic evaluation: Algorithm development cations, a phenomenon that may have occurred within the
apparatus during analysis.
The MRI images, obtained in the DICOM format, underwent
preprocessing in three stages: (I) Reconfiguration to The XRD spectrum of Co O NPs in Figure 2A reveals
4
3
1-mm resolution, (II) application of an anisotropic distinct peaks at 2θ values of 31.45°, 37.17°, 38.79°, 45.10°,
3
diffusion filter, and (III) intensity correction for magnetic 59.72°, 65.54°, and 74.43°, corresponding to the lattice
field inhomogeneity. First, T1-weighted and T2-weighted planes (220), (311), (222), (400), (511), (440), and (620),
11
images were resliced to an isotropic resolution of 1 mm³ respectively. These peaks confirm the cubic phase of Co O
4
3
using cubic spline interpolation. Second, an anisotropic (JCPDS: 65-3103), with lattice parameters a = b = c = 8.056
diffusion filter was employed to mitigate potential noise in Å. 38,52 The FTIR spectrum of these NPs in Figure 2B displays
the images. 46,47 Finally, image homogeneity was enhanced two vibrational modes at 667 and 561 cm , indicative of
−1
through bias correction using an N4ITK filter. 48 Co‒O bonds. 53,54
After preprocessing, the algorithm segmented the Figure 2C presents the XRD spectrum of CuO NPs,
region of interest (ROI) for the automatic determination of where 2θ peaks aligned with the lattice planes (110), (111),
the longitudinal relaxation time (T1). Following this ROI (−112), (−202), (020), (202), (−113), (−311), (113), (311),
Volume 2 Issue 1 (2025) 56 doi: 10.36922/aih.3947