
Page 65 - AIH-2-1
P. 65
Artificial Intelligence in Health Algorithm and metal oxide nanoparticle in MRI
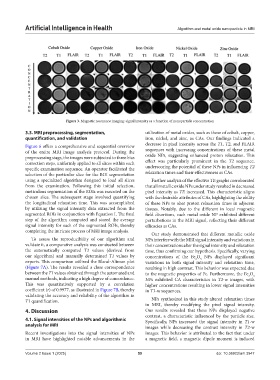
Figure 3. Magnetic resonance imaging: signal intensity as a function of nanoparticle concentration
3.3. MRI preprocessing, segmentation, utilization of metal oxides, such as those of cobalt, copper,
quantification, and validation iron, nickel, and zinc, as CAs. Our findings indicated a
Figure 6 offers a comprehensive and sequential overview decrease in pixel intensity across the T1, T2, and FLAIR
of the entire MRI image analysis protocol. During the sequences with increasing concentrations of these metal
preprocessing stage, the images were subjected to three bias oxide NPs, suggesting enhanced proton relaxation. This
correction steps, uniformly applied to all slices within each effect was particularly prominent in the T2 sequence,
specific examination sequence. An operator facilitated the underscoring the potential of these NPs in influencing T2
selection of the particular slice for the ROI segmentation relaxation times and their effectiveness as CAs.
using a specialized algorithm designed to load all slices Further analysis of the effective TE graphs corroborated
from the examination. Following this initial selection, that all metallic oxide NPs under study resulted in decreased
meticulous segmentation of the ROIs was executed on the pixel intensity as TE increased. This characteristic aligns
chosen slice. The subsequent stage involved quantifying with the desirable attributes of CAs, highlighting the ability
the longitudinal relaxation time. This was accomplished of these NPs to alter proton relaxation times in adjacent
by utilizing the signal intensity data extracted from the tissues. Notably, due to the different in local magnetic
segmented ROIs in conjunction with Equation I. The final field disortions, each metal oxide NP exhibited different
step of the algorithm computed and stored the average perturbations in the MRI signal, reflecting their different
signal intensity for each of the segmented ROIs, thereby efficacies as CAs.
completing the intricate process of MRI image analysis.
Our study demonstrated that different metallic oxide
To assess the reproducibility of our algorithm and NPs interfere with the MRI signal intensity and variations in
validate it, a comparative analysis was conducted between their concentrations alter the signal intensity and relaxation
the automatically computed T1 values (derived from time, thus confirming our hypothesis. Specifically, varying
our algorithm) and manually determined T1 values by concentrations of the Fe O NPs displayed significant
2
3
experts. This comparison utilized the Bland‒Altman plot variations in both signal intensity and relaxation time,
(Figure 7A). The results revealed a close correspondence resulting in high contrast. This behavior was expected due
between the T1 values obtained through the automated and to the magnetic properties of Fe. Furthermore, the Fe O
3
2
manual methods, indicating a high degree of concordance. NPs exhibited CA characteristics in T2-w images, with
This was quantitatively supported by a correlation higher concentrations resulting in lower signal intensities
coefficient (r) of 0.9977, as illustrated in Figure 7B, thereby in T1-w sequences.
validating the accuracy and reliability of the algorithm in
T1 quantification. NPs synthesized in this study altered relaxation times
in MRI, thereby modifying the pixel signal intensity.
4. Discussion Our results revealed that these NPs displayed negative
contrast, a characteristic influenced by the particle size.
4.1. Signal intensities of the NPs and algorithmic Specifically, NPs increased the signal intensity in T1-w
analysis for MRI images while decreasing the contrast intensity in T2-w
Recent investigations into the signal intensities of NPs images. This behavior is attributed to the fact that under
in MRI have highlighted notable advancements in the a magnetic field, a magnetic dipole moment is induced
Volume 2 Issue 1 (2025) 59 doi: 10.36922/aih.3947