
Page 80 - AIH-2-1
P. 80
Artificial Intelligence in Health ViT for Glioma Classification in MRI
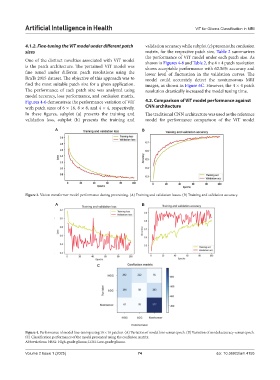
4.1.2. Fine-tuning the ViT model under different patch validation accuracy while subplot (c) presents the confusion
sizes matrix, for the respective patch size. Table 2 summarizes
the performance of ViT model under each patch size. As
One of the distinct novelties associated with ViT model shown in Figures 4-6 and Table 2, the 4 × 4 patch resolution
is the patch architecture. The pertained ViT model was shows acceptable performance with 62.56% accuracy and
fine tuned under different patch resolutions using the lower level of fluctuation in the validation curves. The
BraTs 2015 dataset. The objective of this approach was to model could accurately detect the nontumorous MRI
find the most suitable patch size for a given application. images, as shown in Figure 6C. However, the 4 × 4 patch
The performance of each patch size was analyzed using resolution drastically increased the model tuning time.
model accuracy, loss performance, and confusion matrix.
Figures 4-6 demonstrate the performance variation of ViT 4.2. Comparison of ViT model performance against
with patch sizes of 6 × 16, 8 × 8, and 4 × 4, respectively. CNN architecture
In these figures, subplot (a) presents the training and The traditional CNN architecture was used as the reference
validation loss, subplot (b) presents the training and model for performance comparison of the ViT model
A B
Figure 3. Vision transformer model performance during pretraining. (A) Training and validation losses. (B) Training and validation accuracy.
A B
C
Figure 4. Performance of model fine-tuning using 16 × 16 patches. (A) Variation of model loss versus epoch. (B) Variation of model accuracy versus epoch.
(C) Classification performance of the model presented using the confusion matrix.
Abbreviations: HGG: High-grade glioma; LGG: Low-grade glioma.
Volume 2 Issue 1 (2025) 74 doi: 10.36922/aih.4155