
Page 98 - AIH-2-2
P. 98
Artificial Intelligence in Health Cirrhosis prediction in hepatitis C
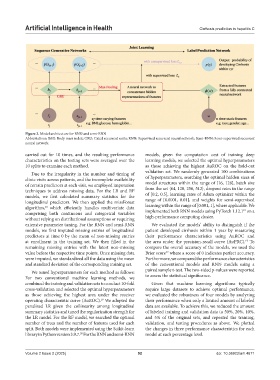
Figure 2. Model architecture for RNN and semi-RNN
Abbreviations: BMI: Body mass index; GRU: Gated recurrent units; RNN: Supervised recurrent neural network; Semi-RNN: Semi-supervised recurrent
neural network.
carried out for 10 times, and the resulting performance models, given the computation cost of training deep
characteristics on the testing sets were averaged over the learning models, we selected the optimal hyperparameters
10 splits to examine each method. as those achieving the highest AuROC on the hold-out
Due to the irregularity in the number and timing of validation set. We randomly generated 100 combinations
clinic visits across patients, and the incomplete availability of hyperparameters, searching the optimal hidden sizes of
of certain predictors at each visit, we employed imputation model structures within the range of [16, 128], batch size
techniques to address missing data. For the LR and RF from the set {64, 128, 256, 512}, dropout rates in the range
models, we first calculated summary statistics for the of [0.2, 0.5], learning rates of Adam optimizer within the
longitudinal predictors. We then applied the missForest range of [0.0001, 0.01], and weights for semi-supervised
algorithm, which efficiently handles multivariate data learning within the range of [0.001, 1], where applicable. We
18
21
comprising both continuous and categorical variables implemented both RNN models using PyTorch 1.12.1 on a
without relying on distributional assumptions or requiring high-performance computing cluster.
extensive parameter tuning. For the RNN and semi-RNN We evaluated the models’ ability to distinguish if the
models, we first imputed missing entries of longitudinal patient developed cirrhosis within 1 year by measuring
predictors at time 0 by the mean of non-missing entries their performance characteristics using AuROC and
at enrollment in the training set. We then filled in the the area under the precision-recall curve (AuPRC). To
19
remaining missing entries with the latest non-missing compare the overall accuracy of the models, we used the
value before the respective time points. Once missing data Brier score where a score of 0 indicates perfect accuracy.
22
were imputed, we standardized all the data using the mean Furthermore, we compared the performance characteristics
and standard deviation of the corresponding training set. of the conventional models and RNN models using a
We tuned hyperparameters for each method as follows: paired sample t-test. The two-sided p-values were reported
For two conventional machine learning methods, we to assess the statistical significance.
combined the training and validation sets to conduct 10-fold Given that machine learning algorithms typically
cross-validation and selected the optimal hyperparameters require large datasets to achieve optimal performance,
as those achieving the highest area under the receiver we evaluated the robustness of four models by analyzing
operating characteristic curve (AuROC). We adopted the their performance when only a limited amount of labeled
19
penalized LR given the collinearity among longitudinal data are available. To achieve this, we reduced the amount
summary statistics and tuned the regularization strength for of labeled training and validation data to 50%, 20%, 10%,
the LR model. For the RF model, we searched the optimal and 5% of the original sets, and repeated the training,
number of trees and the number of features used for each validation, and testing procedures as above. We plotted
split. Both models were implemented using the Scikit-learn the changes in three performance characteristics for each
library in Python version 3.9.7. For the RNN and semi-RNN model at each percentage level.
20
Volume 2 Issue 2 (2025) 92 doi: 10.36922/aih.4671