
Page 99 - AIH-2-2
P. 99
Artificial Intelligence in Health Cirrhosis prediction in hepatitis C
3. Results 176 [66.7] × 103/µL vs 207 [68.1] × 10 /µL) at the time of
3
the sampled visit (time t). Overall, the unlabeled cohort had
3.1. Cohort population characteristics
similar characteristics to the labeled cohort except for a few
Out of the 12,412 labeled samples, most were from men variables. The unlabeled cohort had a larger proportion of
(12,040 [97.0%]). The sample population exhibited a missing data for race/ethnicity groups and genotypes and
racially diverse distribution, with the majority comprising were more likely to achieve SVR at time t than the labeled
individuals of White and Black ethnic backgrounds (Table 1). cohort (13,286 [8.35%] versus 881 [7.10%]).
Compared to the control samples, cases who developed
cirrhosis within 1 year of the sampled visit were less likely 3.2. Prediction of progression to cirrhosis
to achieve SVR (147 [6.74%] versus 734 [7.18%]), had
higher levels of serum AST, ALT, and bilirubin levels (mean The semi-RNN model demonstrated the highest mean
[SD] AST: 66.8 [46.3] U/L versus 46.7 [33.7 U/L; mean [SD] (SD) AuROC (0.785 [0.062]), followed by the RNN model
ALT: 75.7 [69.7] U/L versus 56.3 [51.8] U/L; mean [SD] (0.744, [0.009]), both of which significantly surpass those
bilirubin: 0.767 [0.614] mg/dL versus 0.641 [0.372] mg/dL), attained by the RF and LR models. In addition, both the
higher FIB-4 and APRI scores (mean [SD] FIB-4 score: 3.3 semi-RNN and RNN models demonstrated significantly
[2.7] versus 1.9 [1.9]; mean [SD] APRI score: 3.29 [2.63] higher mean (SD) AuPRCs (0.448 [0.119] and 0.371
versus 2.14 [1.72]), and lower platelet count (mean [SD]: [0.010], respectively), and significantly lower mean (SD)
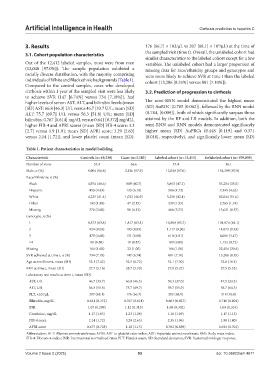
Table 1. Patient characteristics in model building
Characteristic Controls (n=10,230) Cases (n=2,182) Labeled cohort (n=12,412) Unlabeled cohort (n=159,039)
Number of visits 55.4 66.6 57.4 36.1
Male, n (%) 9,904 (96.8) 2,136 (97.9) 12,040 (97.0) 154,299 (97.0)
Race/Ethnicity, n (%)
Black 4,974 (48.6) 889 (40.7) 5,863 (47.2) 53,254 (33.5)
Hispanic 453 (4.43) 133 (6.10) 586 (4.72) 7,345 (4.62)
White 4,235 (41.4) 1,023 (46.9) 5,258 (42.4) 82,044 (51.6)
Other 192 (1.88) 47 (2.15) 239 (1.93) 2,765 (1.74)
Missing 376 (3.68) 90 (4.12) 466 (3.75) 13,631 (8.57)
Genotype, n (%)
1 8,573 (83.8) 1,817 (83.3) 10,390 (83.7) 101,874 (64.1)
2 924 (9.03) 193 (8.85) 1,117 (9.00) 14,873 (9.33)
3 479 (4.68) 131 (6.00) 610 (4.91) 8,686 (5.47)
≥4 90 (0.88) 19 (0.87) 109 (0.88) 1,152 (0.72)
Missing 164 (1.60) 22 (1.00) 186 (1.50) 32,454 (20.4)
SVR achieved at time t, n (%) 734 (7.18) 147 (6.74) 881 (7.10) 13,286 (8.35)
Age at enrollment, mean (SD) 52.1 (7.42) 52.5 (6.72) 52.1 (7.30) 52.8 (19.1)
BMI at time t, mean (SD) 27.7 (5.16) 28.7 (5.70) 27.8 (5.27) 27.5 (5.55)
Laboratory test results at time t, mean (SD)
AST, U/L 46.7 (33.7) 66.8 (46.3) 50.3 (37.0) 47.5 (33.3)
ALT, U/L 56.3 (51.8) 75.7 (69.7) 59.7 (55.9) 56.7 (64.3)
PLT, ×10 /µL 207 (68.1) 176 (66.7) 202 (68.9) 218 (76.8)
3
Bilirubin, mg/dL 0.641 (0.372) 0.767 (0.614) 0.663 (0.427) 0.716 (0.604)
INR 1.07 (0.299) 1.12 (0.313) 1.08 (0.302) 1.09 (0.333)
Creatinine, mg/dL 1.17 (1.05) 1.23 (1.28) 1.18 (1.09) 1.17 (1.13)
FIB-4 score 2.14 (1.72) 3.29 (2.63) 2.35 (1.96) 1.98 (1.40)
APRI score 0.677 (0.728) 1.16 (1.15) 0.762 (0.839) 0.644 (0.701)
Abbreviation: ALT: Alanine aminotransferase; APRI: AST-to-platelet ratio index; AST: Aspartate aminotransferase; BMI: Body mass index;
FIB-4: Fibrosis-4 index; INR: International normalized ratio; PLT: Platelet count; SD: Standard deviation; SVR: Sustained virologic response.
Volume 2 Issue 2 (2025) 93 doi: 10.36922/aih.4671