
Page 74 - AIH-2-3
P. 74
Artificial Intelligence in Health CNN model for leukemia diagnosis
2.2.1. C-NMC dataset 3. Proposed methodology
The C-NMC (The Cancer Genome Atlas) dataset is a 3.1. CNN model architecture
crucial resource for developing and evaluating DL models
for leukemia classification. This section outlines the specific This paper presents a multilevel image classification
methodology employed to leverage the C-NMC dataset for method using DL for leukemia datasets. The proposed
multilevel image classification using DL techniques. 22 CNN model (customized CNN model optimized by
Tversky loss function) with multiple convolutional and
2.2.2. Dataset description dense layers optimized with a Tversky loss function
achieves high accuracy and robustness, demonstrating
The C-NMC dataset comprises a comprehensive collection its potential for aiding in the early diagnosis of
of blood smear images, annotated with labels indicating leukemia. Customized CNN is used for handling
various types of leukemia, including ALL and AML. imbalanced datasets (i.e., different proportions of healthy
The dataset provides a robust foundation for training vs. malignant cells).
and testing DL models aimed at automating leukemia
diagnosis. The proposed model utilizes a CNN, specifically
designed and optimized for multilevel classification tasks
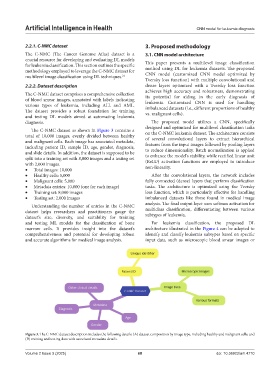
The C-NMC dataset as shown in Figure 3 contains a
total of 10,000 images, evenly divided between healthy on the C-NMC leukemia dataset. The architecture consists
of several convolutional layers to extract hierarchical
and malignant cells. Each image has associated metadata, features from the input images followed by pooling layers
including patient ID, sample ID, age, gender, diagnosis, to reduce dimensionality. Batch normalization is applied
and slide details. In addition, the dataset is supposed to be to enhance the model’s stability, while rectified linear unit
split into a training set with 8,000 images and a testing set (ReLU) activation functions are employed to introduce
with 2,000 images. non-linearity.
• Total images: 10,000
• Healthy cells: 5,000 After the convolutional layers, the network includes
• Malignant cells: 5,000 fully connected (dense) layers that perform classification
• Metadata entries: 10,000 (one for each image) tasks. The architecture is optimized using the Tversky
• Training set: 8,000 images loss function, which is particularly effective for handling
• Testing set: 2,000 images imbalanced datasets like those found in medical image
Understanding the number of entries in the C-NMC analysis. The final output layer uses softmax activation for
dataset helps researchers and practitioners gauge the multiclass classification, differentiating between various
dataset’s size, diversity, and suitability for training subtypes of leukemia.
and testing ML models for the classification of bone For leukemia classification, the proposed DL
marrow cells. It provides insight into the dataset’s architecture illustrated in the Figure 4 can be adapted to
comprehensiveness and potential for developing robust identify and classify leukemia subtypes based on specific
and accurate algorithms for medical image analysis. input data, such as microscopic blood smear images or
Figure 3. The C-NMC dataset description includes the following details: (A) dataset composition by image type, including healthy and malignant cells, and
(B) training and testing data with associated metadata details.
Volume 2 Issue 3 (2025) 68 doi: 10.36922/aih.4710