
Page 77 - AIH-2-3
P. 77
Artificial Intelligence in Health CNN model for leukemia diagnosis
Table 2. (Continued)
Epochs Model Accuracy Precision Recall F1‑Score Method for handling Key contributions
(%) (%) (%) (%) imbalanced data
50 SVM + CNN Hybrid 82 80 81 80.5 No explicit method Final performance stabilizes,
good but not competitive
with DL models
50 Traditional ML 72 70 72 71 No explicit method Best possible performance
but still behind DL
approaches
Abbreviations: CNN: Convolutional neural network; DL: Deep learning; ML: Machine learning; SVM: Support vector machine.
In contrast, models such as ResNet101 Ensemble and
ALLNET show strong performance but do not explicitly
address data imbalance issues, leading to slightly lower
overall accuracy and precision. While these models are
competitive, they fall short in scenarios where balanced
classification is crucial.
Support vector machine + CNN Hybrid and traditional
ML models perform relatively well in earlier epochs but
are ultimately limited by their inability to handle complex
imbalanced datasets and achieve lower performance
metrics compared to the DL approaches.
3.2. Training process
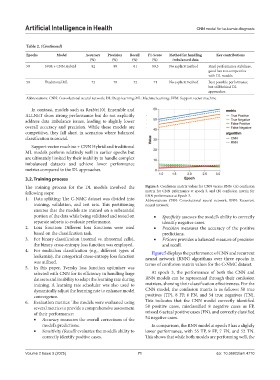
The training process for the DL models involved the Figure 5. Confusion matrix values for CNN versus RNN: (A) confusion
following steps: matrix for CNN prformance at epoch 3, and (B) confusion matrix for
1. Data splitting: The C-NMC dataset was divided into RNN performance at Epoch 3.
Abbreviations: CNN: Convolutional neural network; RNN: Recurrent
training, validation, and test sets. This partitioning neural network.
ensures that the models are trained on a substantial
portion of the data while being validated and tested on • Specificity assesses the model’s ability to correctly
separate subsets to evaluate performance. identify negative cases.
2. Loss function: Different loss functions were used • Precision measures the accuracy of the positive
based on the classification task. predictions.
3. For binary classification (normal vs. abnormal cells), • F1Score provides a balanced measure of precision
the binary cross-entropy loss function was employed. and recall.
4. For multiclass classification (e.g., different types of Figure 5 displays the performance of CNN and recurrent
leukemia), the categorical cross-entropy loss function neural network (RNN) algorithms over three epochs in
was utilized. terms of confusion matrix values for the C-NMC dataset.
5. In this paper, Tversky loss function optimizer was
selected with CNN for its efficiency in handling large At epoch 3, the performance of both the CNN and
datasets and its ability to adapt the learning rate during RNN models can be represented through their confusion
training. A learning rate scheduler was also used to matrices, showing their classification effectiveness. For the
dynamically adjust the learning rate to enhance model CNN model, the confusion matrix is as follows: 58 true
convergence. positives (TP), 8 FP, 6 FN, and 54 true negatives (TN).
6. Evaluation metrics: The models were evaluated using This indicates that the CNN model correctly identified
several metrics to provide a comprehensive assessment 58 positive cases, misclassified 8 negative cases as FP,
of their performance: missed 6 actual positive cases (FN), and correctly classified
• Accuracy measures the overall correctness of the 54 negative cases.
model’s predictions. In comparison, the RNN model at epoch 3 has a slightly
• Sensitivity (Recall) evaluates the model’s ability to lower performance, with 55 TP, 9 FP, 7 FN, and 52 TN.
correctly identify positive cases. This shows that while both models are performing well, the
Volume 2 Issue 3 (2025) 71 doi: 10.36922/aih.4710