
Page 75 - AIH-2-3
P. 75
Artificial Intelligence in Health CNN model for leukemia diagnosis
connections between different abnormalities, such as the
size of blasts and their irregular chromatin patterns, which
are used to differentiate between subtypes of leukemia,
such as ALL or CML. This layer ensures the model can
generalize well across different patient data.
The Activation Function introduces non-linearity,
allowing the network to handle the complex patterns that
distinguish leukemia from other conditions or healthy
samples. For instance, functions such as ReLU or sigmoid
enable the model to prioritize significant features and
ignore irrelevant noise.
The model also includes a Recurrent Hidden Layer,
which is particularly useful if the data have a sequential
or temporal component, such as time-series genetic
expression data or the progression of cellular abnormalities
over time. This layer refines the features further, adding a
temporal dimension to the model’s predictions.
Finally, the Twerky Loss Function is applied to optimize
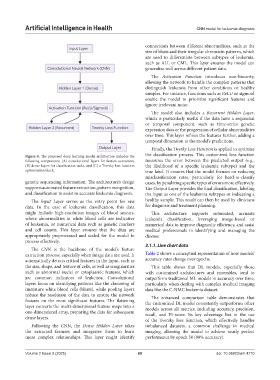
Figure 4. The proposed deep learning model architecture includes the the classification process. This customized loss function
following components: (A) convolutional layers for feature extraction, measures the error between the predicted output (e.g.,
(B) dense layers for classification tasks, and (C) a Tversky loss function the likelihood of a specific leukemia subtype) and the
optimization block. true label. It ensures that the model focuses on reducing
misclassification rates, particularly for hard-to-classify
genetic sequencing information. The architecture’s design cases, by penalizing specific types of errors more effectively.
supports automated feature extraction, pattern recognition, The Output Layer provides the final classification, labeling
and classification to assist in accurate leukemia diagnosis. the input as one of the leukemia subtypes or indicating a
The Input Layer serves as the entry point for raw healthy sample. This result can then be used by clinicians
data. In the case of leukemia classification, this data for diagnosis and treatment planning.
might include high-resolution images of blood smears, This architecture supports automated, accurate
where abnormalities in white blood cells are indicative leukemia classification, leveraging image-based or
of leukemia, or numerical data such as genetic markers numerical data to improve diagnostic efficiency, and assist
and cell counts. This layer ensures that the data are medical professionals in identifying and managing the
appropriately preprocessed and scaled for the model to disease.
process effectively.
3.1.1. Line chart data
The CNN is the backbone of the model’s feature
extraction process, especially when image data are used. It Table 2 shows a conceptual representation of how models’
automatically detects critical features in the input, such as accuracy rates change over epochs.
the size, shape, and texture of cells, as well as irregularities This table shows that DL models, especially those
such as abnormal nuclei or cytoplasmic features, which with customized architectures and ensembles, tend to
are common indicators of leukemia. Convolutional outperform traditional ML models in accuracy over time,
layers focus on identifying patterns like the clustering of particularly when dealing with complex medical imaging
immature white blood cells (blasts), while pooling layers data like the C-NMC leukemia dataset.
reduce the resolution of the data to ensure the network The enhanced comparison table demonstrates that
focuses on the most significant features. The flattening the customized DL model consistently outperforms other
layer converts the multi-dimensional feature maps into a models across all metrics, including accuracy, precision,
one-dimensional array, preparing the data for subsequent recall, and F1-score. Its key advantage lies in the use
dense layers.
of the Tversky loss function, which effectively handles
Following the CNN, the Dense Hidden Layer takes imbalanced datasets, a common challenge in medical
the extracted features and integrates them to learn imaging, allowing the model to achieve nearly perfect
more complex relationships. This layer might identify performance by epoch 50 (99% accuracy).
Volume 2 Issue 3 (2025) 69 doi: 10.36922/aih.4710