
Page 79 - AIH-2-3
P. 79
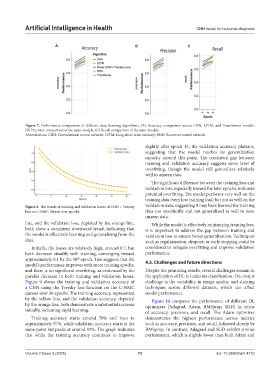
Artificial Intelligence in Health                                        CNN model for leukemia diagnosis


                         A                                 B                     C


            Figure  7. Performance comparison of different deep learning algorithms. (A) Accuracy comparison across CNN, LSTM, and Transformer models.
            (B) Precision comparison of the same models. (C) Recall comparison of the same models.
            Abbreviations: CNN: Convolutional neural network; LSTM: Long short-term memory; RNN: Recurrent neural network.

                                                               slightly after epoch 15, the validation accuracy plateaus,
                                                               suggesting that the model reaches its generalization
                                                               capacity around this point. The consistent gap between
                                                               training and validation accuracy suggests some level of
                                                               overfitting, though the model still generalizes relatively
                                                               well to unseen data.
                                                                 The significant difference between the training loss and
                                                               validation loss, especially toward the later epochs, indicates
                                                               potential overfitting. The model performs very well on the
                                                               training data (very low training loss) but not as well on the
            Figure 8. The trends of training and validation losses of CNN + Tversky   validation data, suggesting it may have learned the training
            loss on C-NMC dataset over epochs.                 data too specifically and not generalized as well to new,
                                                               unseen data.
            line, and the validation loss, depicted by the orange line,   While the model is effectively minimizing training loss,
            both show a consistent downward trend, indicating that   it is important to address the gap between training and
            the model is effectively learning and generalizing from the   validation loss to ensure better generalization. Techniques
            data.                                              such as regularization, dropout, or early stopping could be
              Initially, the losses are relatively high, around 0.7, but   considered to mitigate overfitting and improve validation
            both decrease steadily with training, converging toward   performance.
            approximately 0.1 by the 30  epoch. This suggests that the
                                  th
            model’s performance improves with more training epochs,   4.3. Challenges and future directions
            and there is no significant overfitting, as evidenced by the   Despite the promising results, several challenges remain in
            parallel decrease in both training and validation losses.   the application of DL to leukemia classification. One major
            Figure  9 shows the training and validation accuracy of   challenge is the variability in image quality and staining
            a CNN using the Tversky loss function on the C-NMC   techniques across different datasets, which can affect
            dataset over 30 epochs. The training accuracy, represented   model performance.
            by the yellow line, and the validation accuracy, depicted   Figure  10 compares the performance of different DL
            by the orange line, both demonstrate a substantial increase   optimizers (Adagrad, Adam, RMSprop, SGD) in terms
            initially, indicating rapid learning.              of accuracy, precision, and recall. The Adam optimizer
              Training  accuracy  starts  around  70%  and  rises  to   demonstrates the highest performance across metrics
            approximately 97%, while validation accuracy starts at the   such as accuracy, precision, and recall, followed closely by
            same point but peaks at around 92%. The graph indicates   RMSprop. In contrast, Adagrad and SGD exhibit similar
            that while the training accuracy continues to improve   performance, which is slightly lower than both Adam and


            Volume 2 Issue 3 (2025)                         73                               doi: 10.36922/aih.4710