
Page 161 - AJWEP-22-4
P. 161
Land suitability for coffee Abaya and Gelana
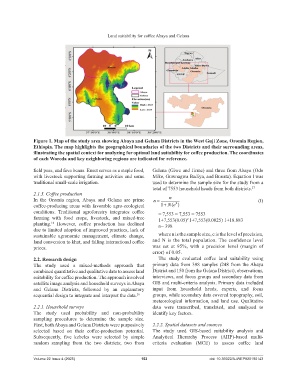
Figure 1. Map of the study area showing Abaya and Gelana Districts in the West Guji Zone, Oromia Region,
Ethiopia. The map highlights the geographical boundaries of the two Districts and their surrounding areas,
illustrating the spatial context for analyzing for optimal land suitability for coffee production. The coordinates
of each Woreda and key neighboring regions are indicated for reference.
field peas, and fava beans. Enset serves as a staple food, Gelana (Giwe and Jirme) and three from Abaya (Odo
with livestock supporting farming activities and some Mike, Guwnagwa Badiya, and Bunata). Equation I was
traditional small-scale irrigation. used to determine the sample size for the study from a
total of 7553 household heads from both districts. 27
2.1.3. Coffee production
In the Oromia region, Abaya and Gelana are prime n n (I)
2
coffee-producing areas with favorable agro-ecological 1 Ne()
conditions. Traditional agroforestry integrates coffee = 7,553 = 7,553 = 7553
farming with food crops, livestock, and mixed-tree 1+7,553(0.05) 1+7,553(0.0025) 1+18.883
2
planting. However, coffee production has declined n= 398
14
due to limited adoption of improved practices, lack of
sustainable agronomic management, climate change, where n is the sample size, e is the level of precision,
land conversion to khat, and falling international coffee and N is the total population. The confidence level
prices. was set at 95%, with a precision level (margin of
error) of 0.05.
2.2. Research design The study evaluated coffee land suitability using
The study used a mixed-methods approach that primary data from 398 samples (248 from the Abaya
combined quantitative and qualitative data to assess land District and 150 from the Gelana District), observations,
suitability for coffee production. The approach involved interviews, and focus groups and secondary data from
satellite image analysis and household surveys in Abaya GIS and multi-criteria analysis. Primary data included
and Gelana Districts, followed by an explanatory input from household heads, experts, and focus
sequential design to integrate and interpret the data. 26 groups, while secondary data covered topography, soil,
meteorological information, and land use. Qualitative
2.2.1. Household surveys data were transcribed, translated, and analyzed to
The study used probability and non-probability identify key factors.
sampling procedures to determine the sample size.
First, both Abaya and Gelana Districts were purposively 2.2.2. Spatial datasets and sources
selected based on their coffee-production potential. The study used GIS-based suitability analysis and
Subsequently, five kebeles were selected by simple Analytical Hierarchy Process (AHP)-based multi-
random sampling from the two districts; two from criteria evaluation (MCE) to assess coffee land
Volume 22 Issue 4 (2025) 153 doi: 10.36922/AJWEP025190143