
Page 163 - AJWEP-22-4
P. 163
Land suitability for coffee Abaya and Gelana
2.3.4. Determination of land suitability for coffee production A weighted overlay integrates inputs by reclassifying
According to literature reviews, expert input, and local advantageous areas to higher values, ensuring the total
knowledge, five main criteria and 11 factors were influence equals 100%. Using the weighted overlay tool
43
identified, including topography (elevation, slope), in ArcGIS, this method mapped land suitability based
46
climate (temperature, rainfall), soil (depth, pH, texture), on standardized criteria:
landscape (LULC), and proximity (to water bodies,
roads, and towns) (Table 1). S = wxi (IV)
Suitability data must be standardized, often Where S denotes suitability, Σ denotes the sum, w
through linear scale transformation. This study used denotes the weights assigned to each factor, and xi
44
standardization and reclassification, with suitability denotes the factor scores (cells).
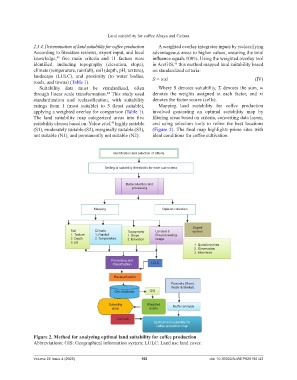
ratings from 1 (most suitable) to 5 (least suitable), Mapping land suitability for coffee production
applying a weighted overlay for comparison (Table 1). involved generating an optimal suitability map by
The land suitability map categorized areas into five filtering areas based on criteria, converting data layers,
suitability classes based on: Yalew et al. highly suitable and using selection tools to refine the best locations
45
(S1), moderately suitable (S2), marginally suitable (S3), (Figure 2). The final map highlights prime sites with
not suitable (N1), and permanently not suitable (N2). ideal conditions for coffee cultivation.
Identification and selection of criteria
Setting of suitability thresholds for each sub-criteria
Data collection and
processing
Mapping Opinion collection
Expert
Soil Climate Topography Landsat 8 opinion
1. Texture 1. Rainfall 1. Slope Pre-processing
2. Depth 2. Temperature 2. Elevation image
3. pH
1. Questionnaires
2. Observation
3. Interviews
Processing and
Classification LULC
Reclassification
Proximity (Road,
Water & Market)
Geo database GIS
Suitability Weighted Buffer analysis
map overly
Con tool
Optimal land suitability for
coffee production map
Figure 2. Method for analyzing optimal land suitability for coffee production
Abbreviations: GIS: Geographical information system; LULC: Land use land cover.
Volume 22 Issue 4 (2025) 155 doi: 10.36922/AJWEP025190143