
Page 20 - AJWEP-22-4
P. 20
Ujianti, et al.
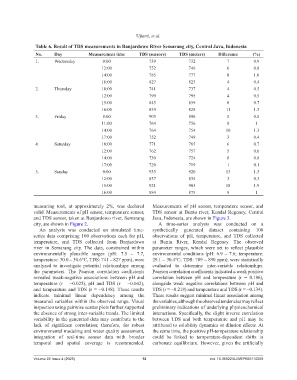
Table 6. Result of TDS measurements in Banjardowo River Semarang city, Central Java, Indonesia
No. Day Measurement time TDS (sensors) TDS (meters) Difference (%)
1. Wednesday 9:00 739 732 7 0.9
12:00 752 746 6 0.8
14:00 785 777 8 1.0
16:00 827 823 4 0.4
2. Thursday 10:00 741 737 4 0.5
12:00 799 795 4 0.5
15:00 845 839 6 0.7
16:00 839 828 11 1.3
3. Friday 8:00 903 898 5 0.5
11:00 764 756 8 1
14:00 764 754 10 1.3
17:00 752 749 3 0.4
4. Saturday 10:00 771 765 6 0.7
12:00 762 757 5 0.6
14:00 730 724 6 0.8
17:00 720 719 1 0.1
5. Sunday 9:00 933 920 13 1.3
12:00 837 834 3 0.3
15:00 921 903 18 1.9
16:00 884 875 9 1
measuring tool, at approximately 2%, was declared Measurements of pH sensor, temperature sensor, and
valid. Measurements of pH sensor, temperature sensor, TDS sensor at Buntu river, Kendal Regency, Central
and TDS sensor, taken at Banjardowo river, Semarang Java, Indonesia, are shown in Figure 3.
city, are shown in Figure 2. A time-series analysis was conducted on a
An analysis was conducted on simulated time- synthetically generated dataset containing 100
series data comprising 100 observations each for pH, observations of pH, temperature, and TDS collected
temperature, and TDS collected from Banjardowo at Buntu River, Kendal Regency. The observed
river in Semarang city. The data, constrained within parameter ranges, which were set to reflect plausible
environmentally plausible ranges (pH: 7.5 – 7.7, environmental conditions (pH: 6.9 – 7.6; temperature:
temperature: 30.0 – 30.6°C, TDS: 741 – 827 ppm), were 29.1 – 30.4°C; TDS: 789 – 890 ppm), were statistically
analyzed to investigate potential relationships among evaluated to determine inter-variable relationships.
the parameters. The Pearson correlation coefficients Pearson correlation coefficients indicated a weak positive
revealed weak-negative associations between pH and correlation between pH and temperature (r = 0.186),
temperature (r = −0.025), pH and TDS (r = −0.042), alongside weak negative correlations between pH and
and temperature and TDS (r = −0.148). These results TDS (r = −0.218) and temperature and TDS (r = −0.134).
indicate minimal linear dependency among the These results suggest minimal linear association among
measured variables within the observed range. Visual the variables, although the observed tendencies may reflect
inspection using pairwise scatter plots further supported preliminary indications of underlying physicochemical
the absence of strong inter-variable trends. The limited interactions. Specifically, the slight inverse correlation
variability in the generated data may contribute to the between TDS and both temperature and pH may be
lack of significant correlation; therefore, for robust attributed to solubility dynamics or dilution effects. At
environmental modeling and water quality assessment, the same time, the positive pH-temperature relationship
integration of real-time sensor data with broader could be linked to temperature-dependent shifts in
temporal and spatial coverage is recommended. carbonate equilibrium. However, given the artificially
Volume 22 Issue 4 (2025) 12 doi: 10.36922/AJWEP025110069