
Page 16 - AJWEP-22-4
P. 16
Ujianti, et al.
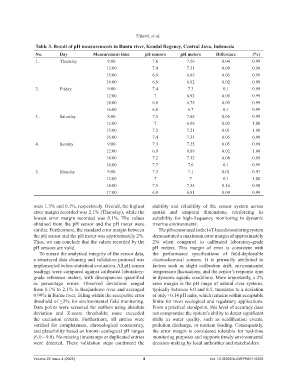
Table 3. Result of pH measurements in Buntu river, Kendal Regency, Central Java, Indonesia
No. Day Measurement time pH sensors pH meters Difference (%)
1. Thursday 9:00 7.6 7.56 0.04 0.99
12:00 7.4 7.31 0.09 0.99
15:00 6.9 6.85 0.05 0.99
16:00 6.9 6.82 0.02 0.99
2. Friday 9:00 7.4 7.3 0.1 0.99
12:00 7 6.92 0.08 0.99
14:00 6.8 6.75 0.05 0.99
16:00 6.8 6.7 0.1 0.99
3. Saturday 8:00 7.5 7.45 0.05 0.99
12:00 7 6.98 0.02 1.00
15:00 7.2 7.21 0.01 1.00
16:00 7.4 7.35 0.05 0.99
4. Sunday 9:00 7.3 7.25 0.05 0.99
12:00 6.9 6.88 0.02 1.00
14:00 7.2 7.12 0.08 0.99
16:00 7.7 7.6 0.1 0.99
5. Monday 9:00 7.3 7.1 0.01 0.97
12:00 7 7 0.1 1.00
14:00 7.5 7.34 0.16 0.98
17:00 6.9 6.81 0.09 0.99
were 1.3% and 0.1%, respectively. Overall, the highest stability and reliability of the sensor system across
error margin recorded was 2.1% (Thursday), while the spatial and temporal dimensions, reinforcing its
lowest error margin recorded was 0.1%. The values suitability for high-frequency monitoring in dynamic
obtained from the pH sensor and the pH meter were riverine environments.
similar. Furthermore, the standard error margin between The pH sensor used in the IoT-based monitoring system
the pH sensor and the pH meter was approximately 2%. demonstrated a maximum error margin of approximately
Thus, we can conclude that the values recorded by the 2% when compared to calibrated laboratory-grade
pH sensors are valid. pH meters. This margin of error is consistent with
To ensure the analytical integrity of the sensor data, the performance specifications of field-deployable
a structured data cleaning and validation protocol was electrochemical sensors. It is primarily attributed to
implemented before statistical evaluation. All pH sensor factors such as slight calibration drift, environmental
readings were compared against calibrated laboratory- temperature fluctuations, and the sensor’s response time
grade reference meters, with discrepancies quantified in dynamic aquatic conditions. More importantly, a 2%
as percentage errors. Observed deviations ranged error margin in the pH range of natural river systems,
from 0.1% to 2.1% in Banjardowo river and averaged typically between 6.0 and 8.5, translates to a deviation
0.99% in Buntu river, falling within the acceptable error of only ±0.14 pH units, which remains within acceptable
threshold of ≤2% for environmental field monitoring. limits for most ecological and regulatory applications.
Data points were screened for outliers using absolute From a practical standpoint, this level of accuracy does
deviation and Z-score thresholds; none exceeded not compromise the system’s ability to detect significant
the exclusion criteria. Furthermore, all entries were shifts in water quality, such as acidification events,
verified for completeness, chronological consistency, pollution discharge, or nutrient loading. Consequently,
and plausibility based on known ecological pH ranges the error margin is considered tolerable for real-time
(6.0 – 9.0). No missing timestamps or duplicated entries monitoring purposes and supports timely environmental
were detected. These validation steps confirmed the decision-making by local authorities and stakeholders.
Volume 22 Issue 4 (2025) 8 doi: 10.36922/AJWEP025110069