
Page 15 - AJWEP-22-4
P. 15
IoT-based water quality monitoring
it scalable for local government and community negligible for most freshwater classification and
monitoring initiatives. compliance standards.
This level of accuracy is sufficient for practical
3. Results and discussion decision-making, particularly in applications such as
early detection of contamination events or algal bloom,
3.1. pH where relative changes in pH are more important
pH values recorded by the IoT-based monitoring than absolute values. The collected high-frequency
50
system showed strong agreement with reference pH (1 Hz) data reflect temporal granularity that enables
meters across both river sites. In Banjardowo river, environmental managers to observe rapid shifts and
the observed error margin ranged from 0.1% to 2.1%, develop time-sensitive response strategies not feasible
while in Buntu River, it remained consistently close with manual sampling methods.
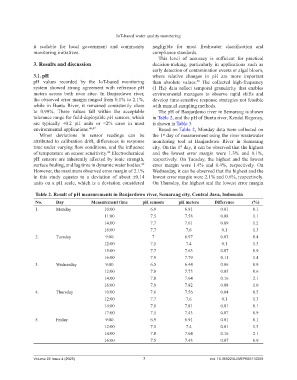
to 0.99%. These values fall within the acceptable The pH of Banjardowo river in Semarang is shown
tolerance range for field-deployable pH sensors, which in Table 2, and the pH of Buntu river, Kendal Regency,
are typically ±0.2 pH units or ≤2% error in most is shown in Table 3.
environmental applications. 46,47 Based on Table 2, Monday data were collected on
Minor deviations in sensor readings can be the 1 day of measurement using the river wastewater
st
attributed to calibration drift, differences in response monitoring tool at Banjardowo River in Semarang
time under varying flow conditions, and the influence city. On the 1 day, it can be observed that the highest
st
of temperature on sensor sensitivity. Electrochemical and the lowest error margin were 1.3% and 0.1%,
48
pH sensors are inherently affected by ionic strength, respectively. On Tuesday, the highest and the lowest
surface fouling, and lag time in dynamic water bodies. error margin were 1.4% and 0.4%, respectively. On
49
However, the maximum observed error margin of 2.1% Wednesday, it can be observed that the highest and the
in this study equates to a deviation of about ±0.14 lowest error margin were 2.1% and 0.6%, respectively.
units on a pH scale, which is a deviation considered On Thursday, the highest and the lowest error margin
Table 2. Result of pH measurements in Banjardowo river, Semarang city, Central Java, Indonesia
No. Day Measurement time pH sensors pH meters Difference (%)
1. Monday 10:00 6.9 6.91 0.01 0.1
11:00 7.5 7.58 0.08 1.1
14:00 7.7 7.61 0.09 1.2
16:00 7.7 7.6 0.1 1.3
2. Tuesday 9:00 7 6.97 0.03 0.4
12:00 7.5 7.4 0.1 1.3
15:00 7.7 7.63 0.07 0.9
16:00 7.9 7.79 0.11 1.4
3. Wednesday 9:00 6.5 6.44 0.06 0.9
12:00 7.8 7.75 0.05 0.6
14:00 7.8 7.64 0.16 2.1
16:00 7.9 7.82 0.08 1.0
4. Thursday 10:00 7.6 7.56 0.04 0.5
12:00 7.7 7.6 0.1 1.3
14:00 7.8 7.81 0.01 0.1
17:00 7.5 7.43 0.07 0.9
5. Friday 9:00 6.9 6.91 0.01 0.1
12:00 7.5 7.4 0.01 1.3
14:00 7.8 7.64 0.16 2.1
16:00 7.5 7.43 0.07 0.9
Volume 22 Issue 4 (2025) 7 doi: 10.36922/AJWEP025110069