
Page 14 - AJWEP-22-4
P. 14
Ujianti, et al.
0.4°C (~1.3%) for temperature, and 1.8 NTU (~3.6% at 2.4. Comparison of the proposed IoT-based water
50 NTU) for turbidity – all within acceptable limits for quality monitoring system with previous studies
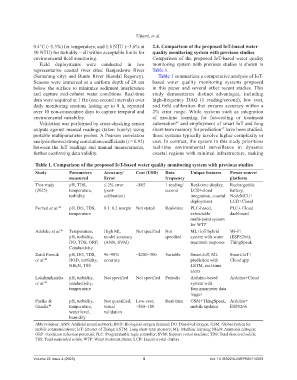
environmental field monitoring. Comparison of the proposed IoT-based water quality
Field deployments were conducted in two monitoring system with previous studies is shown in
representative coastal river sites: Banjardowo River Table 1.
(Semarang city) and Buntu River (Kendal Regency). Table 1 summarizes a comparative analysis of IoT-
Sensors were immersed at a uniform depth of 20 cm based water quality monitoring systems proposed
below the surface to minimize sediment interference in this paper and several other recent studies. This
and capture mid-column water conditions. Real-time study demonstrates distinct advantages, including
data were acquired at 1 Hz (one-second intervals) over high-frequency DAQ (1 reading/second), low cost,
daily monitoring sessions lasting up to 8 h, repeated and field calibration that ensures accuracy within a
over 10 non-consecutive days to capture temporal and 2% error range. While systems such as integration
environmental variability. of machine learning for forecasting or treatment
Validation was performed by cross-checking sensor automation and employment of smart IoT and long
45
outputs against manual readings (taken hourly) using short-term memory for prediction have been studied,
42
portable multiparameter probes. A Pearson correlation those systems typically involve higher complexity or
analysis showed strong correlation coefficients (r ≥ 0.95) cost. In contrast, the system in this study prioritizes
between the IoT readings and manual measurements, real-time environmental surveillance in dynamic
further confirming data validity. coastal regions with minimal infrastructure, making
Table 1. Comparison of the proposed IoT-based water quality monitoring system with previous studies
Study Parameters Accuracy/ Cost (USD) Data Unique features Power source/
measured Error frequency platform
This study pH, TDS, ≤ 2% error ~$85 1 reading/ Real-time display, Rechargeable
(2025) temperature, (post- second LCD+cloud battery,
turbidity calibration) integration, coastal NodeMCU+
deployment LCD+Cloud
Forhad et al. 40 pH, DO, TDS, 0.1–0.2 margin Not stated Real-time PLC-based, PLC+ Cloud
temperature extendable dashboard
multi-point system
for WTP
Adeleke et al. 41 Temperature, High ML Not specified Not ML+IoT hybrid Wi-Fi
pH, turbidity, model accuracy specified system with water (ESP8266),
DO, TDS, ORP, (ANN, SVM) treatment response ThingSpeak
Conductivity
Zaidi Farouk pH, DO, TDS, 96–98% ~$200–300 Variable Smart-IoT, ML Smart-IoT+
et al. 42 BOD, turbidity, accuracy prediction with Cloud app
NH₃N, TSS LSTM, real-time
alerts
Lakshmikantha pH, turbidity, Not specified Not specified Periodic Arduino-based Arduino+Cloud
et al. 43 conductivity, system with
temperature four-parameter data
logger
Pasika & pH, turbidity, Not quantified; Low-cost; Real-time GSM+ThingSpeak, Arduino+
Gandla 44 temperature, visual ~$60–100 mobile updates ESP8266
water level, validation
humidity
Abbreviations: ANN: Artificial neural network; BOD: Biological oxygen demand; DO: Dissolved oxygen; GSM: Global system for
mobile communications; IoT: Internet of Things; LSTM: Long short-term memory; ML: Machine learning; NH 3N: Ammonia nitrogen;
ORP: Oxidation reduction potential; PLC: Programmable logic controller; SVM: Support vector machine; TDS: Total dissolved solids;
TSS: Total suspended solids; WTP: Water treatment plants; LCD: Liquid crystal display.
Volume 22 Issue 4 (2025) 6 doi: 10.36922/AJWEP025110069