
Page 18 - AJWEP-22-4
P. 18
Ujianti, et al.
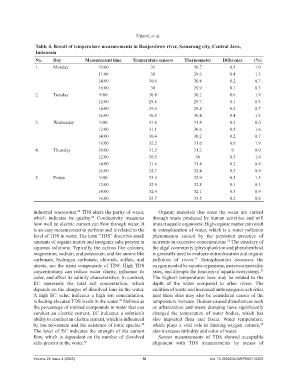
Table 4. Result of temperature measurements in Banjardowo river, Semarang city, Central Java,
Indonesia
No. Day Measurement time Temperature sensors Thermometer Difference (%)
1. Monday 10:00 31 30.7 0.3 1.0
11:00 30 29.6 0.4 1.3
14:00 30.6 30.8 0.2 0.7
16:00 30 29.9 0.1 0.3
2. Tuesday 9:00 30.8 30.2 0.6 1.9
12:00 29.8 29.7 0.1 0.3
14:00 29.6 29.4 0.2 0.7
16:00 30.8 30.4 0.4 1.3
3. Wednesday 9:00 31.6 31.4 0.2 0.6
12:00 31.1 30.6 0.5 1.6
14:00 30.4 30.2 0.2 0.7
16:00 32.2 31.6 0.6 1.9
4. Thursday 10:00 31.2 31.2 0 0.0
12:00 30.5 30 0.5 1.6
14:00 31.6 31.4 0.2 0.6
16:00 32.7 32.4 0.3 0.9
5. Friday 9:00 33.4 32.9 0.5 1.5
12:00 32.9 32.8 0.1 0.3
14:00 32.4 32.1 0.3 0.9
16:00 33.7 33.5 0.2 0.6
industrial wastewater. TDS alters the purity of water, Organic materials that enter the water are carried
54
which indicates its quality. Conductivity measures through waste produced by human activities and will
48
how well an electric current can flow through water. It impact aquatic organisms. High organic matter can result
is an easy measurement to perform and is related to the in eutrophication of water, which is a water pollution
level of TDS in water. The term “TDS” describes small phenomenon caused by the persistent presence of
amounts of organic matter and inorganic salts present in nutrients in excessive concentrations. The structure of
52
aqueous solutions. Typically, the cations like calcium, the algal community (phytoplankton and phytobenthos)
magnesium, sodium, and potassium, and the anions like is generally used to evaluate eutrophication and organic
carbonate, hydrogen carbonate, chloride, sulfate, and pollution of rivers. Eutrophication decreases the
53
nitrate, are the main components of TDS. High TDS oxygen needed by aquatic organisms, increases mortality
concentrations can reduce water clarity, influence its rates, and disrupts the function of aquatic ecosystems.
55
color, and affect its salinity characteristics. In contrast, The highest temperatures here may be related to the
EC represents the total salt concentration, which depth of the water compared to other rivers. The
depends on the charges of dissolved ions in the water. addition of waste and increased anthropogenic activities
A high EC value indicates a high ion concentration, near these sites may also be considered causes of the
reflecting elevated TDS levels in the water. Defined as temperature increase. Human-caused disturbances such
49
the percentage of ionized compounds in water that can as urbanization and waste dumping have significantly
conduct an electric current, EC indicates a solution’s changed the temperature of water bodies, which has
ability to conduct an electric current, which is influenced also impacted flora and fauna. Water temperature,
by ion movement and the existence of ionic species. which plays a vital role in limiting oxygen content,
48
54
The level of EC indicates the strength of the current also increases turbidity and color of water.
flow, which is dependent on the number of dissolved Sensor measurements of TDS showed acceptable
salts present in the water. 50 alignment with TDS measurements by means of
Volume 22 Issue 4 (2025) 10 doi: 10.36922/AJWEP025110069