
Page 19 - AJWEP-22-4
P. 19
IoT-based water quality monitoring
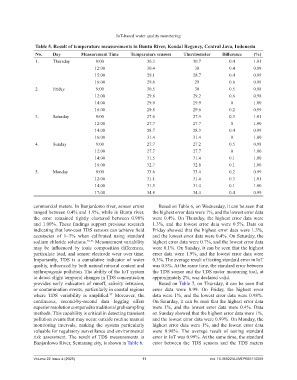
Table 5. Result of temperature measurements in Buntu River, Kendal Regency, Central Java, Indonesia
No. Day Measurement Time Temperature sensors Thermometer Difference (%)
1. Thursday 9:00 30.3 30.7 0.4 1.01
12:00 30.4 30 0.4 0.99
15:00 29.1 28.7 0.4 0.99
16:00 29.6 29 0.6 0.98
2. Friday 9:00 30.5 30 0.5 0.98
12:00 29.8 29.2 0.6 0.98
14:00 29.9 29.9 0 1.00
16:00 29.8 29.6 0.2 0.99
3. Saturday 9:00 27.6 27.9 0.3 1.01
12:00 27.7 27.7 0 1.00
14:00 28.7 28.3 0.4 0.99
16:00 31.4 31.4 0 1.00
4. Sunday 9:00 27.7 27.2 0.5 0.98
12:00 27.7 27.7 0 1.00
14:00 31.5 31.4 0.1 1.00
16:00 32.7 32.8 0.1 1.00
5. Monday 9:00 33.6 33.4 0.2 0.99
12:00 31.1 31.4 0.3 1.01
14:00 31.5 31.4 0.1 1.00
17:00 34.8 34.4 0.4 0.99
commercial meters. In Banjardowo river, sensor errors Based on Table 6, on Wednesday, it can be seen that
ranged between 0.4% and 1.9%, while in Buntu river, the highest error data were 1%, and the lowest error data
the error remained tightly clustered between 0.98% were 0.4%. On Thursday, the highest error data were
and 1.00%. These findings support previous research 1.3%, and the lowest error data were 0.5%. Data on
indicating that low-cost TDS sensors can achieve field Friday showed that the highest error data were 1.3%,
accuracies of 1–3% when calibrated using standard and the lowest error data were 0.4%. On Saturday, the
sodium chloride solutions. 55,56 Measurement variability highest error data were 0.7%, and the lowest error data
may be influenced by ionic composition differences, were 0.1%. On Sunday, it can be seen that the highest
particulate load, and sensor electrode wear over time. error data were 1.9%, and the lowest error data were
Importantly, TDS is a cumulative indicator of water 0.3%. The average result of testing standard error in IoT
quality, influenced by both natural mineral content and was 0.8%. At the same time, the standard error between
anthropogenic pollution. The ability of the IoT system the TDS sensor and the TDS meter measuring tool, at
to detect slight temporal changes in TDS concentration approximately 2%, was declared valid.
provides early indicators of runoff, salinity intrusion, Based on Table 7, on Thursday, it can be seen that
or contamination events, particularly in coastal regions error data were 0.99. On Friday, the highest error
where TDS variability is amplified. Moreover, the data were 1%, and the lowest error data were 0.98%.
57
continuous, second-by-second data logging offers On Saturday, it can be seen that the highest error data
superior resolution compared to traditional grab sampling were 1%, and the lowest error data were 0.4%. Data
methods. This capability is critical in detecting transient on Sunday showed that the highest error data were 1%,
pollution events that may occur outside routine manual and the lowest error data were 0.99%. On Monday, the
monitoring intervals, making the system particularly highest error data were 1%, and the lowest error data
valuable for regulatory surveillance and environmental were 0.98%. The average result of testing standard
risk assessment. The result of TDS measurements in error in IoT was 0.99%. At the same time, the standard
Banjardowo River, Semarang city, is shown in Table 6. error between the TDS sensors and the TDS meters
Volume 22 Issue 4 (2025) 11 doi: 10.36922/AJWEP025110069