Page 38 - AJWEP-22-4
P. 38

Qin, et al.

                              A                                            B


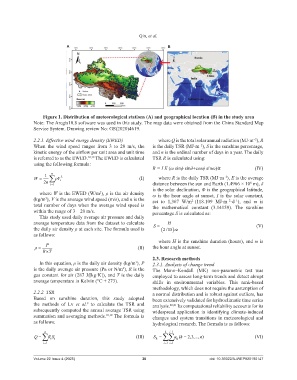
                    Figure 1. Distribution of meteorological stations (A) and geographical location (B) in the study area
                Note: The Arcgis10.8 software was used in this study. The map data were obtained from the China Standard Map
                Service System. Drawing review No: GS(2020)4619.


                2.2.1. Effective wind energy density (EWED)            where Q is the total solar annual radiation (MJ·m ), R
                                                                                                                 −2
                When  the  wind speed  ranges  from 3 to  20  m/s,  the   is the daily TSR (MJ·m ), S is the sunshine percentage,
                                                                                         −2
                kinetic energy of the airflow per unit area and unit time   and n is the ordinal number of days in a year. The daily
                is referred to as the EWED. 10,18  The EWED is calculated   TSR R is calculated using:
                using the following formula:
                                                                    R = I E (ω sinϕ sinδ+cosϕ sinω)⁄π            (IV)
                        n
                     1      3                                                                       −2
                W       V i                                (I)      where R is the daily TSR (MJ·m ), E is the average
                                                                                                               8
                    2 n                                             distance between the sun and Earth (1.4966 × 10  m), δ
                       i1
                                                                    is the solar declination, Φ is the geographical latitude,
                  where W is the EWED (W/m ), ρ is the air density   ω is the hour angle at sunset, I is the solar constant,
                                             2
                (kg/m ), V is the average wind speed (m/s), and n is the   set to 1,367  W/m (118.109 MJ·m ·d ), and  π is
                     3
                                                                                                        −1
                                                                                                     −2
                                                                                     2
                total number of days when the average wind speed is   the  mathematical  constant  (3.14159).  The  sunshine
                within the range of 3 – 20 m/s.                     percentage S is calculated as:
                  This study used daily average air pressure and daily
                average temperature data from the dataset to calculate     H                                      (V)
                the daily air density ρ at each site. The formula used is   S   215/
                as follows:
                                                                       where H is the sunshine duration (hours), and ω is
                     P
                                                            (II)  the hour angle at sunset.

                    RT
                                                                    2.3. Research methods
                  In this equation, ρ is the daily air density (kg/m ), P   2.3.1. Analysis of change trend
                                                             3
                is the daily average air pressure (Pa or N/m ), R is the   The  Mann–Kendall  (MK) non-parametric  test  was
                                                       2
                gas constant for air (287 J/[kg·K]), and T is the daily   employed to assess long-term trends and detect abrupt
                average temperature in Kelvin (°C + 273).           shifts in environmental  variables.  This rank-based
                                                                    methodology, which does not require the assumption of
                2.2.2. TSR                                          a normal distribution and is robust against outliers, has
                Based on sunshine duration, this study adopted      been extensively validated for hydroclimatic time series
                the methods of Lv  et al.  to calculate  the  TSR and   analysis. 20,21  Its computational reliability accounts for its
                                       8
                subsequently computed the annual average TSR using   widespread application in identifying climate-induced
                summation and averaging methods. 10,19  The formula is   changes and system transitions in meteorological and
                as follows:                                         hydrological research. The formula is as follows:

                     n                                                    k  i1
                                                                      k
                Q   R S                                    (III)   S       a k  23(  , ,..., n)              (VI)
                       ii
                                                                               ij
                    i1                                                  i1  i1

                Volume 22 Issue 4 (2025)                        30                           doi: 10.36922/AJWEP025190147
   33   34   35   36   37   38   39   40   41   42   43