
Page 43 - AJWEP-22-4
P. 43
Spatiotemporal variability and climate forcing mechanisms
A B
C D
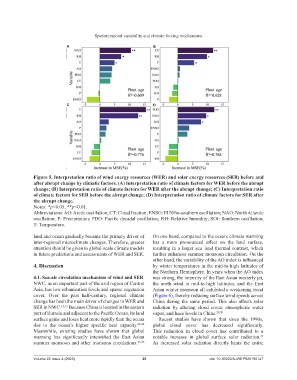
Figure 5. Interpretation ratio of wind energy resources (WER) and solar energy resources (SER) before and
after abrupt change by climatic factors. (A) Interpretation ratio of climate factors for WER before the abrupt
change; (B) Interpretation ratio of climate factors for WER after the abrupt change; (C) Interpretation ratio
of climate factors for SER before the abrupt change; (D) Interpretation ratio of climate factors for SER after
the abrupt change.
Notes: *p<0.05, **p<0.01.
Abbreviations: AO: Arctic oscillation; CT: Cloud fraction; ENSO: El Niño-southern oscillation; NAO: North Atlantic
oscillation; P: Precipitation; PDO: Pacific decadal oscillation; RH: Relative humidity; SOI: Southern oscillation;
T: Temperature.
land and ocean gradually became the primary driver of On one hand, compared to the ocean, climate warming
inter-regional microclimate changes. Therefore, greater has a more pronounced effect on the land surface,
attention should be given to global-scale climate models resulting in a larger sea–land thermal contrast, which
in future predictions and assessments of WER and SER. further enhances summer monsoon circulation. On the
other hand, the variability of the AO index is influenced
4. Discussion by winter temperatures in the mid-to-high latitudes of
the Northern Hemisphere. In years when the AO index
4.1. Sea-air circulation mechanism of wind and SER was strong, the intensity of the East Asian westerly jet,
NWC, as an important part of the arid region of Central the north wind in mid-to-high latitudes, and the East
Asia, has low urbanization levels and sparse vegetation Asian winter monsoon all exhibited a weakening trend
cover. Over the past half-century, regional climate (Figure 6), thereby reducing surface wind speeds across
change has been the main driver of changes in WER and China during the same period. This also affects solar
SER in NWC. 12,13 Because China is located in the eastern radiation by altering cloud cover, atmospheric water
part of Eurasia and adjacent to the Pacific Ocean, its land vapor, and haze levels in China. 29,30
surface gains and loses heat more rapidly than the ocean Recent studies have shown that since the 1990s,
due to the ocean’s higher specific heat capacity. 22-24 global cloud cover has decreased significantly.
Meanwhile, existing studies have shown that global This reduction in cloud cover has contributed to a
warming has significantly intensified the East Asian notable increase in global surface solar radiation.
31
summer monsoon and other monsoon circulations. 25-28 As increased solar radiation directly heats the entire
Volume 22 Issue 4 (2025) 35 doi: 10.36922/AJWEP025190147