
Page 42 - AJWEP-22-4
P. 42
Qin, et al.
A B
C D
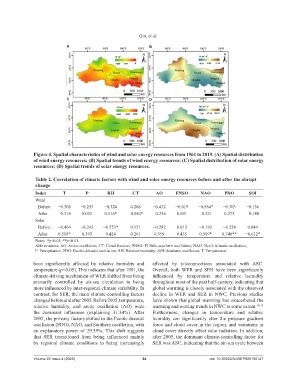
Figure 4. Spatial characteristics of wind and solar energy resources from 1961 to 2019. (A) Spatial distribution
of wind energy resources; (B) Spatial trends of wind energy resources; (C) Spatial distribution of solar energy
resources; (D) Spatial trends of solar energy resources.
Table 2. Correlation of climate factors with wind and solar energy resources before and after the abrupt
change
Index T P RH CT AO ENSO NAO PDO SOI
Wind
Before −0.306 −0.233 −0.324 0.208 −0.432 −0.019 −0.584* −0.303 −0.156
After −0.316 0.021 0.516* −0.584* −0.236 0.091 −0.221 0.273 −0.188
Solar
Before −0.464 −0.243 −0.553* 0.121 −0.282 0.013 −0.193 −0.224 0.044
After 0.518* 0.393 0.424 0.261 0.359 0.455 0.589* 0.746** −0.612*
Notes: *p<0.05; **p<0.01.
Abbreviations: AO: Arctic oscillation; CT: Cloud fraction; ENSO: El Niño-southern oscillation; NAO: North Atlantic oscillation;
P: Precipitation; PDO: Pacific decadal oscillation; RH: Relative humidity; SOI: Southern oscillation; T: Temperature.
been significantly affected by relative humidity and affected by teleconnections associated with ASC.
temperature (p<0.05). This indicates that after 1991, the Overall, both WER and SER have been significantly
climate-driving mechanism of WER shifted from being influenced by temperature and relative humidity
primarily controlled by air-sea circulation to being throughout most of the past half-century, indicating that
more influenced by inter-regional climate variability. In global warming is closely associated with the observed
contrast, for SER, the main climate-controlling factors decline in WER and SER in NWC. Previous studies
changed before and after 2005. Before 2005, temperature, have shown that global warming has exacerbated the
relative humidity, and arctic oscillation (AO) were warming and wetting trends in NWC to some extent. 10-13
the dominant influences (explaining 31.34%). After Furthermore, changes in temperature and relative
2005, the primary factors shifted to the Pacific decadal humidity can significantly alter the pressure gradient
oscillation (PDO), NAO, and Southern oscillation, with force and cloud cover in the region, and variations in
an explanatory power of 29.59%. This shift suggests cloud cover directly affect solar radiation. In addition,
that SER transitioned from being influenced mainly after 2005, the dominant climate-controlling factor for
by regional climate conditions to being increasingly SER was ASC, indicating that the air-sea cycle between
Volume 22 Issue 4 (2025) 34 doi: 10.36922/AJWEP025190147