
Page 40 - AJWEP-22-4
P. 40
Qin, et al.
A B
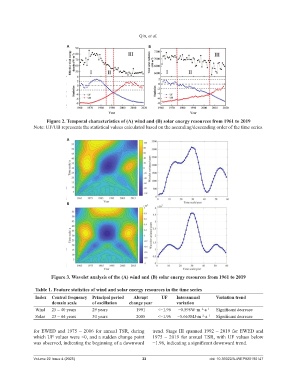
Figure 2. Temporal characteristics of (A) wind and (B) solar energy resources from 1961 to 2019
Note: UF/UB represents the statistical values calculated based on the ascending/descending order of the time series.
A
B
Figure 3. Wavelet analysis of the (A) wind and (B) solar energy resources from 1961 to 2019
Table 1. Feature statistics of wind and solar energy resources in the time series
Index Central frequency Principal period Abrupt UF Interannual Variation trend
domain scale of oscillation change year variation
Wind 25 – 40 years 29 years 1991 <−1.96 −0.598W·m ·a −1 Significant decrease
−2
Solar 23 – 44 years 30 years 2005 <−1.96 −5.663MJ·m ·a −1 Significant decrease
−2
for EWED and 1975 – 2006 for annual TSR, during trend. Stage III spanned 1992 – 2019 for EWED and
which UF values were <0, and a sudden change point 1975 – 2019 for annual TSR, with UF values below
was observed, indicating the beginning of a downward −1.96, indicating a significant downward trend.
Volume 22 Issue 4 (2025) 32 doi: 10.36922/AJWEP025190147