
Page 56 - AJWEP-22-4
P. 56
Basu
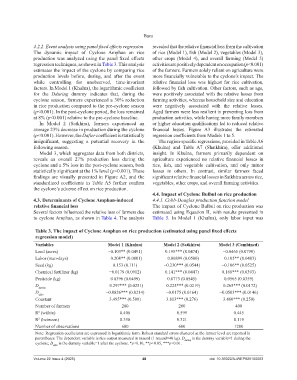
4.2.2. Event analysis using panel fixed effects regression revealed that the relative financial loss from the cultivation
The dynamic impact of Cyclone Amphan on rice of rice (Model 1), fish (Model 2), vegetables (Model 3),
production was analyzed using the panel fixed effects other crops (Model 4), and overall farming (Model 5)
regression techniques, as shown in Table 3. This analysis activities are positively dependent on occupation (p<0.001)
estimates the impact of the cyclone by comparing rice of the farmers. Farmers solely reliant on agriculture were
production levels before, during, and after the event more financially vulnerable to the cyclone’s impact. The
while controlling for unobserved, time-invariant relative financial loss was highest for rice cultivation,
factors. In Model 1 (Khulna), the logarithmic coefficient followed by fish cultivation. Other factors, such as age,
for the Dduring dummy indicates that, during the were positively associated with the relative losses from
cyclone season, farmers experienced a 30% reduction farming activities, whereas household size and education
in rice production compared to the pre-cyclone season were negatively associated with the relative losses.
(p<0.001). In the post-cyclone period, the loss remained Aged farmers were less resilient in preventing loss from
at 8% (p<0.001) relative to the pre-cyclone baseline. production activities, while having more family members
In Model 2 (Satkhira), farmers experienced an or higher education qualifications led to reduced relative
average 23% decrease in production during the cyclone financial losses. Figure A3 illustrates the estimated
(p<0.001). However, the Dafter coefficient is statistically regression coefficients from Models 1 to 5.
insignificant, suggesting a potential recovery in the The region-specific regressions, provided in Table A6
following season. (Khulna) and Table A7 (Shatkhira), offer additional
Model 3, which aggregates data from both districts, insight. In Khulna, farmers primarily dependent on
reveals an overall 27% production loss during the agriculture experienced no relative financial losses in
cyclone and a 5% loss in the post-cyclone season, both rice, fish, and vegetable cultivation, and only minor
statistically significant at the 1% level (p<0.001). These losses in others. In contrast, similar farmers faced
findings are visually presented in Figure A2, and the significant relative financial losses in Satkhira across rice,
standardized coefficients in Table A5 further confirm vegetables, other crops, and overall farming activities.
the cyclone’s adverse effect on rice production.
4.4. Impact of Cyclone Bulbul on rice production
4.3. Determinants of Cyclone Amphan‑induced 4.4.1. Cobb-Douglas production function model
relative financial loss The impact of Cyclone Bulbul on rice production was
Several factors influenced the relative loss of farmers due estimated using Equation II, with results presented in
to cyclone Amphan, as shown in Table 4. The analysis Table 5. In Model 1 (Khulna), only labor input was
Table 3. The impact of Cyclone Amphan on rice production (estimated using panel fixed effects
regression model)
Variables Model 1 (Khulna) Model 2 (Satkhira) Model 3 (Combined)
Land (acres) −0.103** (0.0491) 0.195*** (0.0474) −0.0465 (0.0790)
Labor (man-days) −0.208** (0.0801) −0.00899 (0.0500) −0.105** (0.0483)
Seed (kg) 0.153 (0.111) −0.230*** (0.0544) −0.106** (0.0525)
Chemical fertilizer (kg) −0.0179 (0.0912) 0.141*** (0.0447) 0.168*** (0.0393)
Pesticide (kg) 0.0396 (0.0499) 0.0773 (0.0545) 0.0565 (0.0359)
D during −0.297*** (0.0251) −0.225*** (0.0219) −0.265*** (0.0172)
D after −0.0826*** (0.0214) −0.0175 (0.0164) −0.0503*** (0.0146)
Constant 3.495*** (0.508) 3.813*** (0.276) 3.460*** (0.250)
Number of farmers 200 200 400
R (within) 0.406 0.599 0.445
2
R (between) 0.350 0.321 0.119
2
Number of observations 600 600 1200
Note: Regression coefficients are expressed in logarithmic form. Robust standard errors clustered at the farmer level are reported in
parentheses. The dependent variable is rice output measured in maund (1 maund=40 kg). D during is the dummy variable=1 during the
cyclone; D after is the dummy variable=1 after the cyclone. *p<0.10, **p<0.05, ***p<0.01.
Volume 22 Issue 4 (2025) 48 doi: 10.36922/AJWEP025100063