
Page 57 - AJWEP-22-4
P. 57
Impact of cyclones on rice farming
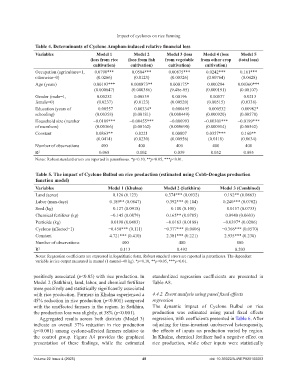
Table 4. Determinants of Cyclone Amphan‑induced relative financial loss
Variables Model 1 Model 2 Model 3 (loss Model 4 (loss Model 5
(loss from rice (loss from fish from vegetable from other crop (total loss)
cultivation) cultivation) cultivation) cultivation)
Occupation (agriculture=1, 0.0790*** 0.0504*** 0.00875*** 0.0242*** 0.161***
otherwise=0) (0.0266) (0.0123) (0.00326) (0.00764) (0.0428)
Age (years) 0.00193*** 0.000873** 0.000175* 0.000294 0.00360***
(0.000647) (0.000386) (9.48e-05) (0.000191) (0.00107)
Gender (male=1, 0.00232 0.00539 0.00196 −0.00537 −0.0213
female=0) (0.0237) (0.0123) (0.00520) (0.00515) (0.0338)
Education (years of −0.00557 −0.00334* −0.000495 −0.000532 −0.00982*
schooling) (0.00358) (0.00181) (0.000449) (0.000920) (0.00570)
Household size (number −0.0109*** −0.00455*** −0.000993 −0.00301*** −0.0199***
of members) (0.00366) (0.00162) (0.000690) (0.000914) (0.00562)
Constant 0.0863** 0.0221 0.00807 0.0357*** 0.160**
(0.0414) (0.0230) (0.00956) (0.0118) (0.0634)
Number of observations 400 400 400 400 400
R 2 0.068 0.102 0.039 0.052 0.095
Notes: Robust standard errors are reported in parentheses. *p<0.10, **p<0.05, ***p<0.01.
Table 5. The impact of Cyclone Bulbul on rice production (estimated using Cobb‑Douglas production
function model)
Variables Model 1 (Khulna) Model 2 (Satkhira) Model 3 (Combined)
Land (acres) 0.126 (0.123) 0.374*** (0.0932) 0.192** (0.0863)
Labor (man-days) 0.189** (0.0847) 0.392*** (0.104) 0.240*** (0.0702)
Seed (kg) −0.127 (0.0918) −0.100 (0.108) −0.0157 (0.0733)
Chemical fertilizer (kg) −0.145 (0.0879) 0.165** (0.0785) 0.0940 (0.0603)
Pesticide (kg) 0.0190 (0.0483) −0.0163 (0.0188) −0.0397* (0.0206)
Cyclone (affected=1) −0.450*** (0.111) −0.377*** (0.0606) −0.366*** (0.0570)
Constant 4.721*** (0.410) 2.381*** (0.221) 2.935*** (0.230)
Number of observations 400 400 800
R 2 0.113 0.492 0.203
Notes: Regression coefficients are expressed in logarithmic form. Robust standard errors are reported in parentheses. The dependent
variable is rice output measured in maund (1 maund=40 kg). *p<0.10, **p<0.05, ***p<0.01.
positively associated (p<0.05) with rice production. In standardized regression coefficients are presented in
Model 2 (Satkhira), land, labor, and chemical fertilizer Table A8.
were positively and statistically significantly associated
with rice production. Farmers in Khulna experienced a 4.4.2. Event analysis using panel fixed effects
45% reduction in rice production (p<0.001) compared regression
with the unaffected farmers in the region. In Satkhira, The dynamic impact of Cyclone Bulbul on rice
the production loss was slightly, at 38% (p<0.001). production was estimated using panel fixed effects
Aggregated results across both districts (Model 3) regression, with coefficients presented in Table 6. After
indicate an overall 37% reduction in rice production adjusting for time-invariant unobserved heterogeneity,
(p<0.001) among cyclone-affected farmers relative to the effects of inputs on production varied by region.
the control group. Figure A4 provides the graphical In Khulna, chemical fertilizer had a negative effect on
presentation of these findings, while the estimated rice production, while other inputs were statistically
Volume 22 Issue 4 (2025) 49 doi: 10.36922/AJWEP025100063