Page 187 - AJWEP-22-5
P. 187

Use of coal gangue for mine backfill

                 Table 1. X‑ray fluorescence analysis results of coal   was continued for 10 min using a mechanical mixer at
                 gangue and fly ash                                 200 r/min until homogeneous slurry was achieved. The

                 Molecular formula  Coal gangue (%)   Fly ash (%)   well-mixed slurry was then promptly poured into standard
                 SiO 2                   51.25           47.51      100 mm × 100 mm × 100 mm cubic molds and allowed
                                                                    to cure for 7, 14, and 28 days for subsequent testing.
                 Al O 3                  26.59           37.34
                   2
                 Fe O 3                   5.78           5.31       2.2.2. Effect of coal gangue particle size matching on
                   2
                 SO 3                     4.33           1.94       slurry performance
                 TiO 2                    4.09           2.01       The  particle  grading  design  theory,  first  developed
                 K O                      2.93           2.01       for  concrete  aggregates,  uses  mathematical  models
                  2                                                 to  achieve  optimal  packing  and  dense  stacking  of
                 Na O                     1.64            -
                   2                                                differently  sized  particles  and  thus  enhance  both
                 CaO                      1.62           3.06       mechanical  properties  and  workability.  The  classic
                 MgO                      1.23           0.30       Fuller  curve,  an  exponential  function  describing
                 P O 5                    0.27           0.23       continuous  gradation,  is  widely  used;  however,  the
                  2
                 V O 5                    0.09            -         discontinuous size distribution that typically results from
                  2
                 ZrO                      0.06           0.08       crushing coal gangue limits its applicability. To better
                    2                                               characterize and optimize gangue particle distributions,
                 SrO                      0.05           0.06       this study adopts an improved variant of the “imethod.”
                 MnO                      0.03           0.03       The variant introduces a dynamic grading coefficient,
                 ZnO                      0.02           0.04       iₖ, to achieve non-geometric coordination among size
                 Cr O 3                   0.02            -         fractions, as expressed in Equation I.
                   2
                 Cl                        -             0.04                    d  i k
                                                                                 x
                 CeO 2                     -             0.04          P 100    D                              (I)
                                                                        x
                 PbO                       -             0.01
                 Note: “-” indicates content below detection limit.    Where  P   represents  the  cumulative  percentage
                                                                               x
                                                                    passing  through  the  x   sieve  mesh,  d   is  the  sieve
                                                                                         th
                                                                                                        x
                                                                    aperture, D is the maximum particle size (5 mm), and i
                                                                                                                    k
                                                                    is the grading coefficient for the k  particle size fraction.
                                                                                                 th
                                                                       Laser  particle  size  analysis  revealed  a  distinct
                                                                    boundary at 1 mm and 3 mm, allowing classification into
                                                                    three fractions: Coarse (3 – 5 mm), medium (1 – 3 mm),
                                                                    and fine (<1 mm). These fractions serve, respectively,
                                                                    as  skeleton  support,  filler,  and  lubricant/cementitious
                                                                    components. Previous studies have shown that when the
                                                                    fine particle content is below 70 wt%, the slurry is prone
                                                                    to segregation with water separation rate exceeding 15%.
                                                                    Conversely, when the coarse particle content is below
                                                                    6%,  the  improvement  in  slurry  flowability  becomes
                                                                    slow. Based on these findings, grading constraints were
                                                                    imposed: The fine particles (<1 mm) must account for at
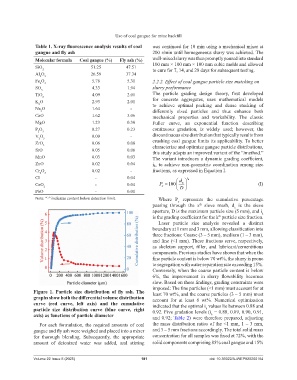
                Figure  1.  Particle  size  distribution  of  fly  ash.  The   least 70 wt%, and the coarse particles (3 – 5 mm) must
                graphs show both the differential volume distribution   account  for  at  least  6  wt%.  Numerical  optimization
                curve  (red  curve,  left  axis)  and  the  cumulative   indicated that the optimal i  values lie between 0.88 and
                particle  size  distribution  curve  (blue  curve,  right   0.92. Five gradation levels (i  = 0.88, 0.89, 0.90, 0.91,
                                                                                            k
                axis) as functions of particle diameter             and 0.92; Table 2) were therefore prepared, adjusting
                                                                                              k
                  For each formulation, the required amounts of coal   the mass distribution ratios of the <1 mm, 1 – 3 mm,
                gangue and fly ash were weighed and placed into a mixer   and 3 – 5 mm fractions accordingly. The total solid mass
                for  thorough  blending.  Subsequently,  the  appropriate   concentration for all samples was fixed at 72%, with the
                amount  of  deionized  water  was  added,  and  stirring   solid components comprising 85% coal gangue and 15%


                Volume 22 Issue 5 (2025)                       181                           doi: 10.36922/AJWEP025200154
   182   183   184   185   186   187   188   189   190   191   192