
Page 56 - AJWEP-22-6
P. 56
Bahar, et al.
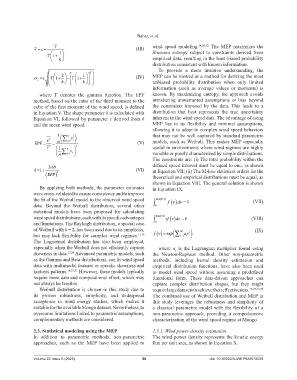
v wind speed modeling. 14,20,32 The MEP maximizes the
v = = (III) Shannon entropy subject to constraints derived from
c
Γ + 1 1
k empirical data, resulting in the least-biased probability
distribution consistent with known information.
To provide a more intuitive understanding, the
1 2 2
σ = v + 1 − Γ + 1 Γ c (IV) MEP can be viewed as a method for deriving the most
k k unbiased probability distribution when only limited
information (such as average values or moments) is
where Γ denotes the gamma function. The EPF known. By maximizing entropy, the approach avoids
method, based on the ratio of the third moment to the introducing unwarranted assumptions or bias beyond
cube of the first moment of the wind speed, is defined the constraints imposed by the data. This leads to a
in Equation V. The shape parameter k is calculated with distribution that best represents the true uncertainty
Equation VI, followed by parameter c derived from k inherent in the wind speed data. The advantage of using
and the mean wind speed. MEP lies in its flexibility and minimal assumptions,
allowing it to adapt to complex wind speed behaviors
1 n 3 ) that may not be well captured by standard parametric
v
v 3 n (∑ i =1 i models, such as Weibull. This makes MEP especially
EPF = = (V)
v 3 1 n 3 useful in environments where wind regimes are highly
v
=1 i ∑ i variable or poorly characterized by simple distributions.
n
The constraints are: (i) The total probability within the
3.69 defined speed interval must be equal to one, as shown
= +
k 1 (VI) in Equation VII; (ii) The M-low statistical orders for the
(EPF ) 2 theoretical and empirical distributions must be equal, as
shown in Equation VIII. The general solution is shown
By applying both methods, the parameter estimates in Equation IX.
were cross-validated to ensure consistency and to improve
the fit of the Weibull model to the observed wind speed ∫ maxf ()v f ( ) v dv = 1 (VII)
data. Beyond the Weibull distribution, several other 0
statistical models have been proposed for calculating
wind speed distributions, each with its specific advantages maxf v () vf vdvv (VIII)
and limitations. The Rayleigh distribution, a special case 0
of Weibull with k = 2, has been used due to its simplicity, M i ) (IX)
i
but may lack flexibility for complex wind regimes. 11,19 fv () = exp i (∑ =1 a v
The Lognormal distribution has also been employed,
especially when the Weibull does not efficiently capture where α is the Lagrangian multiplier found using
i
skewness in data. 17,24 Advanced parametric models, such the Newton-Raphson method. Other non-parametric
as the Gamma and Beta distributions, can fit wind speed methods, including kernel density estimation and
data with multimodal features or specific skewness and empirical distribution functions, have also been used
kurtosis patterns. 18,27,31 However, these models typically to model wind speed without assuming a predefined
require more data and computational effort, which may functional form. These data-driven approaches can
not always be feasible. capture complex distribution shapes, but they might
Weibull distribution is chosen in this study due to require large datasets to achieve their effectiveness. 13,27,33,34
its proven robustness, simplicity, and widespread The combined use of Weibull distribution and MEP in
acceptance in wind energy studies, which makes it this study leverages the robustness and simplicity of
suitable for the available Mongo dataset. Nevertheless, to a classical parametric model with the flexibility of a
overcome limitations linked to parametric assumptions, non-parametric approach, providing a comprehensive
complementary methods are considered. characterization of the wind speed regime at Mongo.
2.3. Statistical modeling using the MEP 2.3.1. Wind power density estimation
In addition to parametric methods, non-parametric The wind power density represents the kinetic energy
approaches, such as the MEP have been applied to flux per unit area, as shown in Equation X.
Volume 22 Issue 6 (2025) 50 doi: 10.36922/AJWEP025070039