
Page 60 - AJWEP-22-6
P. 60
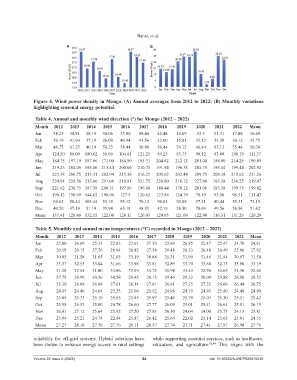
Bahar, et al.

                              A                                    B


                Figure 4. Wind power density in Mongo. (A) Annual averages from 2012 to 2022; (B) Monthly variations
                highlighting seasonal energy potential.


                 Table 4. Annual and monthly wind direction (°) for Mongo (2012 – 2022)
                 Month   2012   2013   2014   2015    2016    2017     2018    2019    2020     2021    2022   Mean
                 Jan     38.25  34.81  28.19  34.06   33.00   49.44   45.44    18.69    52.5   51.31   17.88   36.69
                 Feb     59.19  41.94  37.19  26.00   40.94   41.56   32.00    15.81   35.12   33.38   30.12   35.75
                 Mar     46.75  61.25  40.19  58.25   38.44   30.88   56.44    54.12   46.44   65.12   55.44   50.30
                 Apr    124.50  86.00  180.62  56.69  104.81  121.25  89.25    83.75   98.12   83.88   196.19  111.37
                 May    184.75 197.19 187.06 171.00  184.50   185.31  204.62  212.12   201.00  158.00  214.25  190.89
                 Jun    219.25 204.06 195.56 213.44  200.06   210.75  191.94  196.38   205.75  195.44  199.44  202.92
                 Jul    223.38 206.75 213.31 202.94  215.38   216.25  205.62  202.44   209.75  208.38  219.62  211.26
                 Aug    224.94 228.56 215.00 211.06  210.81   231.75  220.00  216.12   227.88  193.38  230.25  219.07
                 Sept   221.62 236.75 187.38 206.31  197.56   196.88  180.44  178.12   201.06  183.38  199.75  199.02
                 Oct    196.12 150.69 144.62 196.06   127.5   120.62  123.88  124.19   70.19   93.50   98.31   131.43
                 Nov     69.62  50.44  105.44  53.19  95.12   70.12   96.81    92.88   57.31   80.44   55.31   75.15
                 Dec     40.50  47.19  51.19  35.94   65.19   48.31   42.19    58.50   70.69   49.56   58.56   51.62
                 Mean   137.41 128.80 132.15 122.08   126.11  126.93  124.05  121.09   122.98  116.31  131.26  126.29


                 Table 5. Monthly and annual mean temperatures (°C) recorded in Mongo (2012 – 2022)
                 Month    2012    2013    2014    2015    2016    2017    2018    2019    2020   2021   2022   Mean
                 Jan      25.00   26.69   25.33   22.83   23.61   27.30   22.69  26.85   22.47   25.47  24.70  24.81
                 Feb      29.18   29.15   27.76   28.94   26.82   27.38   29.48  28.33   26.48   26.49  25.96  27.82
                 Mar      30.05   31.58   31.65   31.63   33.19   30.88   31.31  31.90   31.46   31.84  30.97  31.50
                 Apr      33.37   32.53   33.04   31.66   33.98   33.81   32.89  33.70   33.80   32.73  33.60  33.19
                 May      31.18   32.55   31.80   33.86   33.59   33.75   31.98  33.43   32.96   32.65  31.36  32.65
                 Jun      27.78   29.99   30.56   30.58   29.43   29.15   29.44  29.32   30.09   29.88  28.50  29.52
                 Jul      25.30   26.88   26.98   27.61   26.14   27.01   26.61  27.35   27.22   26.66  26.44  26.75
                 Aug      24.45   24.40   24.64   25.33   25.06   25.52   24.98  24.79   24.85   25.40  24.48  24.90
                 Sep      25.05   25.33   25.19   25.55   25.85   25.97   25.49  25.79   25.03   25.30  25.11  25.42
                 Oct      25.98   26.53   25.80   26.78   26.60   27.77   26.09  25.01   25.41   26.64  25.51  26.19
                 Nov      26.01   27.12   25.64   25.92   27.20   27.83   26.30  24.04   24.00   25.73  24.13  25.81
                 Dec      23.94   25.21   24.74   22.44   25.87   26.42   25.64  22.02   25.14   25.65  23.01  24.55
                 Mean     27.27   28.16   27.76   27.76   28.11   28.57   27.74  27.71   27.41   27.87  26.98  27.76


                reliability for off-grid systems. Hybrid solutions have   while supporting essential services, such as healthcare,
                been shown to enhance energy access in rural settings   education,  and  agriculture. 38,44   This  aligns  with  the


                Volume 22 Issue 6 (2025)                        54                           doi: 10.36922/AJWEP025070039