
Page 58 - AJWEP-22-6
P. 58
Bahar, et al.
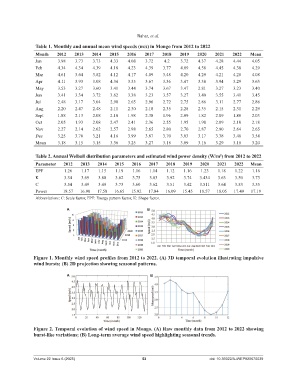
Table 1. Monthly and annual mean wind speeds (m/s) in Mongo from 2012 to 2022
Month 2012 2013 2014 2015 2016 2017 2018 2019 2020 2021 2022 Mean
Jan 3.98 3.73 3.73 4.33 4.08 3.72 4.2 3.72 4.37 4.28 4.44 4.05
Feb 4.34 4.34 4.39 4.18 4.23 4.39 3.77 4.09 4.58 4.45 4.38 4.29
Mar 4.61 3.64 3.82 4.12 4.17 4.09 3.48 4.20 4.29 4.21 4.28 4.08
Apr 4.11 3.93 3.08 4.34 3.35 3.67 3.36 3.47 3.38 3.94 3.29 3.63
May 3.53 3.27 3.60 3.41 3.44 3.74 3.67 3.47 2.81 3.27 3.23 3.40
Jun 3.41 3.34 3.72 3.62 3.38 3.23 3.57 3.27 3.40 3.55 3.41 3.45
Jul 2.48 3.17 3.04 2.90 2.65 2.96 2.72 2.75 2.86 3.11 2.77 2.86
Aug 2.20 2.47 2.48 2.11 2.30 2.18 2.35 2.28 2.35 2.15 2.31 2.29
Sept 1.88 2.13 2.08 2.10 1.98 2.38 1.96 2.09 1.82 2.09 1.80 2.03
Oct 2.05 1.93 2.08 2.47 2.41 2.36 2.55 1.95 1.98 2.09 2.10 2.18
Nov 2.27 2.14 2.62 2.57 2.98 2.65 2.80 2.70 2.87 2.90 2.64 2.65
Dec 3.25 3.70 3.21 4.16 3.99 3.87 3.70 3.03 3.17 3.38 3.48 3.54
Mean 3.18 3.15 3.15 3.36 3.25 3.27 3.18 3.09 3.16 3.29 3.18 3.20
Table 2. Annual Weibull distribution parameters and estimated wind power density (W/m²) from 2012 to 2022
Parameter 2012 2013 2014 2015 2016 2017 2018 2019 2020 2021 2022 Mean
EPF 1.26 1.17 1.15 1.19 1.16 1.14 1.12 1.16 1.23 1.18 1.22 1.16
K 3.34 3.69 3.80 3.62 3.75 3.83 3.92 3.74 3.434 3.63 3.50 3.73
C 3.54 3.49 3.49 3.73 3.60 3.62 3.51 3.42 3.511 3.64 3.53 3.55
Power 18.57 16.90 17.58 16.65 15.92 17.84 16.09 15.45 18.57 18.05 17.49 17.19
Abbreviations: C: Scale factor; EPF: Energy pattern factor; K: Shape factor.
A B
Figure 1. Monthly wind speed profiles from 2012 to 2022. (A) 3D temporal evolution illustrating impulsive
wind bursts; (B) 2D projection showing seasonal patterns.
A B
Figure 2. Temporal evolution of wind speed in Mongo. (A) Raw monthly data from 2012 to 2022 showing
burst-like variations; (B) Long-term average wind speed highlighting seasonal trends.
Volume 22 Issue 6 (2025) 52 doi: 10.36922/AJWEP025070039