
Page 62 - AJWEP-22-6
P. 62
Bahar, et al.
A B
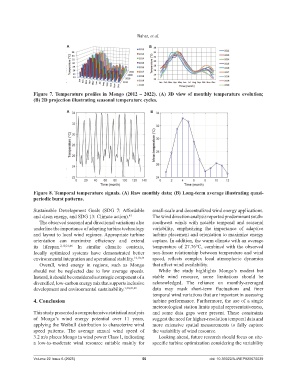
Figure 7. Temperature profiles in Mongo (2012 – 2022). (A) 3D view of monthly temperature evolution;
(B) 2D projection illustrating seasonal temperature cycles.
A B
Figure 8. Temporal temperature signals. (A) Raw monthly data; (B) Long-term average illustrating quasi-
periodic burst patterns.
Sustainable Development Goals (SDG 7: Affordable small-scale and decentralized wind energy applications.
and clean energy, and SDG 13: Climate action). 45 The wind direction analysis reported predominant south-
The observed seasonal and directional variations also southwest winds with notable temporal and seasonal
underline the importance of adapting turbine technology variability, emphasizing the importance of adaptive
and layout to local wind regimes. Appropriate turbine turbine placement and orientation to maximize energy
orientation can maximize efficiency and extend capture. In addition, the warm climate with an average
its lifespan. 2,10,21,46 In similar climatic contexts, temperature of 27.76°C, combined with the observed
locally optimized systems have demonstrated better non-linear relationship between temperature and wind
environmental integration and operational stability. 12,18,35 speed, reflects complex local atmospheric dynamics
Overall, wind energy in regions, such as Mongo that affect wind availability.
should not be neglected due to low average speeds. While the study highlights Mongo’s modest but
Instead, it should be considered a strategic component of a stable wind resource, some limitations should be
diversified, low-carbon energy mix that supports inclusive acknowledged. The reliance on monthly-averaged
development and environmental sustainability. 7,30,47,48 data may mask short-term fluctuations and finer
temporal wind variations that are important in assessing
4. Conclusion turbine performance. Furthermore, the use of a single
meteorological station limits spatial representativeness,
This study presented a comprehensive statistical analysis and some data gaps were present. These constraints
of Mongo’s wind energy potential over 11 years, suggest the need for higher-resolution temporal data and
applying the Weibull distribution to characterize wind more extensive spatial measurements to fully capture
speed patterns. The average annual wind speed of the variability of wind resource.
3.2 m/s places Mongo in wind power Class 1, indicating Looking ahead, future research should focus on site-
a low-to-moderate wind resource suitable mainly for specific turbine optimization considering the variability
Volume 22 Issue 6 (2025) 56 doi: 10.36922/AJWEP025070039