
Page 59 - AJWEP-22-6
P. 59
Statistical analysis of wind energy
Table 3. Monthly Weibull distribution parameters and wind power density (W/m²)
Parameter Jan Feb Mar Apr May Jun Jul Aug Sep Oct Nov Dec
EPF 1.01 1.01 1.02 1.03 1.02 1.01 1.01 1.01 1.02 1.03 1.02 1.03
K 4.59 4.64 4.57 4.46 4.58 4.65 4.59 4.63 4.56 4.48 4.51 4.47
C 4.44 4.67 4.47 3.98 3.73 3.77 3.12 2.50 2.22 2.39 2.90 3.88
Power 14.70 12.00 14.36 20.59 24.57 24.19 28.91 10.45 1.99 6.60 25.15 22.03
Abbreviations: C: Scale factor; EPF: Energy pattern factor; K: Shape factor.
The estimated annual wind power density (Table 2)
ranges from a minimum of 15.45 W/m² (2019) to a
maximum of 18.57 W/m² (2012 and 2020), which
classifies Mongo as a Class 1 site, suitable for small-
scale wind energy projects or hybrid systems combined
with solar photovoltaic. 11,17,21,28,38 Monthly variations
(Table 3, Figure 4) indicate July as the peak month
for wind power density (28.91 W/m²), and September
as the lowest (1.99 W/m²), consistent with the
regional climatology marked by wet and dry seasonal
wind shifts. 19,21,26 Compared to high-potential sites
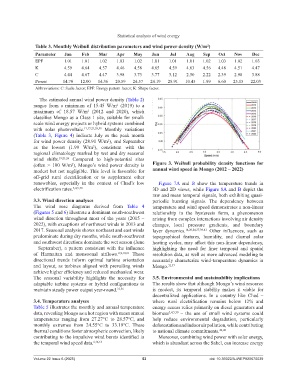
(often > 100 W/m²), Mongo’s wind power density is Figure 3. Weibull probability density functions for
modest but not negligible. This level is favorable for annual wind speed in Mongo (2012 – 2022)
off-grid rural electrification or to supplement other
renewables, especially in the context of Chad’s low Figure 7A and B show the temperature trends in
electrification rates. 3,4,5,30 3D and 2D views, while Figure 8A and B depict the
raw and mean temporal signals, both exhibiting quasi-
3.3. Wind direction analyses periodic bursting signals. The dependency between
The wind rose diagrams derived from Table 4 temperature and wind speed demonstrates a non-linear
(Figures 5 and 6) illustrate a dominant south-southwest relationship in the hysteresis form, a phenomenon
wind direction throughout most of the years (2015 – arising from complex interactions involving air density
2022), with exceptions of northwest winds in 2013 and changes, local pressure gradients, and boundary
2017. Seasonal analysis shows northeast and east winds layer dynamics. 14,20,24,37,39-41 Other influences, such as
predominate during dry months, while south-southwest topographical features, humidity, and diurnal solar
and southwest directions dominate the wet season (June heating cycles, may affect this non-linear dependency,
– September), a pattern consistent with the influence highlighting the need for finer temporal and spatial
of Harmattan and monsoonal airflows. 2,9,10,21 These resolution data, as well as more advanced modeling to
directional trends inform optimal turbine orientation accurately characterize wind-temperature dynamics in
and layout, as turbines aligned with prevailing winds Mongo. 32,37
achieve higher efficiency and reduced mechanical wear.
The seasonal variability highlights the necessity for 3.5. Environmental and sustainability implications
adaptable turbine systems or hybrid configurations to The results show that although Mongo’s wind resource
maintain steady power output year-round. 31,36 is modest, its temporal stability makes it viable for
decentralized applications. In a country like Chad –
3.4. Temperature analyses where rural electrification remains below 12% and
Table 5 illustrates the monthly and annual temperature energy access relies primarily on diesel generators and
data, revealing Mongo as a hot region with mean annual biomass 3,4,5,30 – the use of small wind systems could
temperatures ranging from 27.27°C to 28.57°C, and help reduce environmental degradation, particularly
monthly extremes from 24.55°C to 33.19°C. These deforestation and indoor air pollution, while contributing
thermal conditions foster atmospheric convection, likely to national climate commitments. 42,43
contributing to the impulsive wind bursts identified in Moreover, combining wind power with solar energy,
the temporal wind speed data. 6,14,18 which is abundant across the Sahel, can increase energy
Volume 22 Issue 6 (2025) 53 doi: 10.36922/AJWEP025070039