
Page 136 - {PDF Title}
P. 136
Vardhini and Nakka
Table 4. Results of MGs under various conditions
Specification Without RERs ZOA MFOA SFSN
Energy losses (kWh) 1.4×10 5 7.434×10 4 7.98140×10 4 7.74459×10 4
The amount of procurement energy from substation (kWh) 3.2088×10 6 1.3802×10 6 1.5356×10 6 1.4434×10 6
PV unit (kW) - 215 295 230
WT unit (kW) - 147 135 208
Cost of energy loss ($) 7.0341×10 3 4.7888×10 3 4.6876×10 3 4.6467×10 3
Cost of purchase energy ($) 8.8403×10 5 3.1426×10 5 2.9426×10 5 3.0915×10 5
Cost PV ($) - 3.71928×10 4 3.23764×10 4 2.90563×10 4
Cost of wind turbine ($) - 7.15469×10 4 1.25469×10 5 1.05425×10 5
Total cost ($) 0.89106×10 6 0.4277×10 6 0.4567×10 6 0.4482×10 6
Abbreviations: MFOA: Moth-flame optimization algorithm; MGs: Microgrids; PV: Photovoltaic; RERs: Renewable energy resources;
SFSN: Stochastic fractal search Network; ZOA: Zebra optimization algorithm.
A B
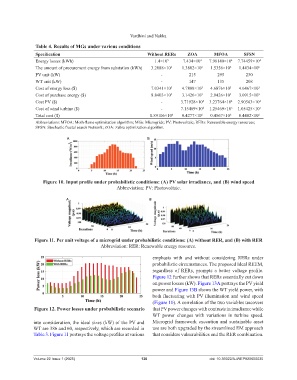
Figure 10. Input profile under probabilistic conditions: (A) PV solar irradiance, and (B) wind speed
Abbreviation: PV: Photovoltaic.
A B
Figure 11. Per unit voltage of a microgrid under probabilistic conditions: (A) without RER, and (B) with RER
Abbreviation: RER: Renewable energy resource.
emphasis with and without considering RERs under
probabilistic circumstances. The proposed Ideal REEM,
regardless of RERs, prompts a better voltage profile.
Figure 12 further shows that RERs essentially cut down
on power losses (kW). Figure 13A portrays the PV yield
power and Figure 13B shows the WT yield power, with
both fluctuating with PV illumination and wind speed
(Figure 10). A correlation of the two variables uncovers
Figure 12. Power losses under probabilistic scenario that PV power changes with contrasts in irradiance while
WT power changes with variations in turbine speed.
into consideration, the ideal sizes (kW) of the PV and Microgrid framework execution and sustainable asset
WT are 386 and 60, respectively, which are recorded in use are both upgraded by the streamlined EM approach
Table 3. Figure 11 portrays the voltage profiles at various that considers vulnerabilities and the RER combination.
Volume 22 Issue 1 (2025) 130 doi: 10.36922/AJWEP025050030