
Page 134 - {PDF Title}
P. 134
Vardhini and Nakka
The voltage profiles with and without RERs are In terms of the defined objective functions, ZOA
shown in Figure 4, and when the RERs were optimally outperformed MFOA and SFSN, as shown in Table 3,
integrated, the voltage profiles significantly improved. which contrasts their results. The simulation results
displayed in Table 4 were obtained by applying the
Table 2. Grid specifications Evolutionary ZOA, MFOA, and SFSN.
Specification Value The losses, ideal sizes of the sustainable power
Voltage in p.u (minimum) 0.9344 sources and purchase cost of energy taken from the
Voltage drop in p.u 0.38 grid, and all-out cost are assessed through proposed
Real load in kW 4 calculation and with other standard improvement
Reactive power in KVAr 3.9 methods like SFSN and MFOA. The outcomes
Losses in kW of the grid 20 obviously show that the proposed ZOA calculation
outperformed in all previously mentioned angles in
any events when RERs were not thought of. Without
Table 3. Results of MGs under various conditions integrating the environmentally friendly power assets,
Specification Without With RERs the general expense of the framework is to be $89106,
RERs simultaneously considering the absolute expenses of
Losses (kWh) 1.45688×10 5 9.8650×10 4 sustainable power assets at $427,700, $456,700, and
Procurement energy 3.45787×10 6 2.9501×10 6 $448,200 for ZOA, MFOA, and SFSN, respectively.
(kWh) In addition, Table 3 records the ideal sizes for PV, and
PV unit (kW) 0 386 WT units. Figure 5 shows an enhanced power quality
Optimization size 0 60 in terms of active power loss (kW) with and without
of the WT (kW) RER incorporation through proposed ZOA. When the
Overall energy 8.74149×10 3 5.18867×10 3 solar irradiance or the wind speed changed, the PV
loss cost ($) unit’s and WT’s power outputs also changed, which
Overall cost of 3.54878×10 6 2.0951×10 6 can be seen in Figures 6 and 7, respectively. The goal
procurement energy ($) capability union is achieved when ZOA, SFSN, and
Cost PV ($) 0 4.83465×10 4 MFOA were utilized, which is portrayed in Figure 8. By
th
Cost of wind turbine ($) 0 2.47426×10 4 the 30 emphasis, ZOA showed supporting assembly.
Total cost ($) 3.5575×10 6 2.17337×10 6 This demonstrates that ZOA is an amazing asset for
Abbreviations: MGs: Microgrids; PV: Photovoltaic; tracking down ideal answers for the predefined REEM
RERs: Renewable energy resources; WT: Wind turbine. issue.
A B
C
D
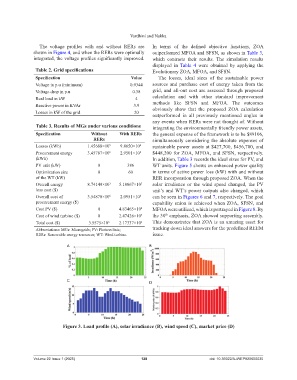
Figure 3. Load profile (A), solar irradiance (B), wind speed (C), market price (D)
Volume 22 Issue 1 (2025) 128 doi: 10.36922/AJWEP025050030