
Page 94 - {PDF Title}
P. 94
Nzama and Olarewaju
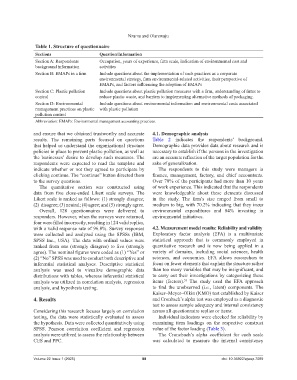
Table 1. Structure of questionnaire
Sections Question/Information
Section A: Respondents Occupation, years of experience, firm scale, indication of environmental cost and
background information activities
Section B: EMAPs in a firm Include questions about the implementation of such practices as a corporate
environmental strategy, firm environmental-related activities, their perspective of
EMAPs, and factors influencing the adoption of EMAPs
Section C: Plastic pollution Include questions about plastic pollution measures with a firm, understanding of firms to
control reduce plastic waste, and barriers to implementing alternative methods of packaging.
Section D: Environmental Include questions about environmental information and environmental costs associated
management practices on plastic with plastic pollution
pollution control
Abbreviation: EMAPs: Environmental management accounting practices.
and ensure that we obtained trustworthy and accurate 4.1. Demographic analysis
results. The remaining parts focused on questions Table 2 indicates the respondents’ background.
that helped us understand the organizational structure Demographic data provides data about research and is
policies in place to prevent plastic pollution, as well as necessary to establish if the persons in the investigation
the businesses’ desire to develop such measures. The are an accurate reflection of the target population for the
respondents were expected to read the template and sake of generalization.
indicate whether or not they agreed to participate by The respondents to this study were managers in
clicking continue. The “continue” button directed them finance, management, factory, and chief accountants.
to the survey questions. Over 70% of the participants had more than 10 years
The quantitative section was constructed using of work experience. This indicated that the respondents
data from five close-ended Likert scale surveys. The were knowledgeable about these elements discussed
Likert scale is ranked as follows: (1) strongly disagree; in the study. The firm’s size ranged from small to
(2) disagree; (3) neutral; (4) agree; and (5) strongly agree. medium to big, with 70.2% indicating that they incur
Overall, 128 questionnaires were delivered to environmental expenditures and 84% investing in
responders. However, when the surveys were returned, environmental initiatives.
four were filled incorrectly, resulting in 124 valid replies,
with a valid response rate of 96.8%. Survey responses 4.2. Measurement model results: Reliability and validity
were collected and analyzed using the SPSSs (IBM, Exploratory factor analysis (EFA) is a multivariate
SPSS Inc., USA). The data with ordinal values were statistical approach that is commonly employed in
ranked from one (strongly disagree) to five (strongly quantitative research and is now being applied in a
agree). The nominal figures were coded as (1) “Yes” or variety of domains, including social sciences, health
(2) “No” SPSS was used to conduct both descriptive and sciences, and economics. EFA allows researchers to
inferential statistical analyses. Descriptive statistical focus on fewer elements that explain the structure rather
analysis was used to visualize demographic data than too many variables that may be insignificant, and
distributions with tables, whereas inferential statistical to carry out their investigations by categorizing these
analysis was utilized in correlation analysis, regression items (factors). The study used the EFA approach
55
analysis, and hypothesis testing. to find the unobserved (i.e., latent) components. The
Kaiser–Meyer–Olkin (KMO) test established by Kaiser
4. Results and Cronbach’s alpha test was employed as a diagnostic
test to assess sample adequacy and internal consistency
Considering this research focuses largely on correlation across all questionnaire replies or items.
testing, the data were statistically evaluated to assess Individual indicators were checked for reliability by
the hypothesis. Data were collected quantitatively using examining item loadings on the respective construct
SPSS. Pearson correlation coefficient and regression value of the factor loading (Table 3).
analysis were utilized to assess the relationship between The Croncbach’s alpha coefficient for each scale
CES and PPC. was calculated to measure the internal consistency
Volume 22 Issue 1 (2025) 88 doi: 10.36922/ajwep.7089