Page 95 - {PDF Title}
P. 95

CES on plastic pollution control

                 Table 2. Demographic information
                 Item                             Description                       Frequency              Percentage
                 Job designation                  Financial manager                    31                     25
                                                  Management accountant                32                     25.8
                                                  Factory accountant                   31                     25
                                                  Chief accountant                     30                     24.2
                 Employment experience            0–5 years                            11                     8.9
                                                  6–10 years                           25                     20.2
                                                  11–15 years                          36                     29
                                                  16–20 years                          36                     29
                                                  >21 years                            16                     12.9
                 Firm scale                       Small                                57                     46
                                                  Medium                               39                     31.5
                                                  Large                                28                     22.6
                 Environmental costs              Yes                                  87                     70.2
                                                  No                                   37                     29.8
                 Environmental activities         Yes                                  84                     67.7
                                                  No                                   40                     32.2


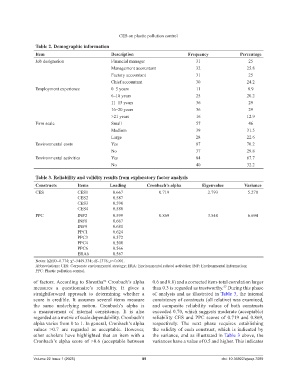
                 Table 3. Reliability and validity results from exploratory factor analysis
                 Constructs        Items         Loading          Cronbach’s alpha        Eigenvalue         Variance
                 CES               CES1            0.667               0.719                2.793             5.270
                                   CES2            0.587
                                   CES3            0.590
                                   CES4            0.580
                 PPC               INF2            0.599               0.869                3.548             6.694
                                   INF8            0.667
                                   INF9            0.681
                                   PPC1            0.624
                                   PPC3            0.572
                                   PPC4            0.500
                                   PPC6            0.566
                                   ERA6            0.567
                 Notes: KMO=0.774; χ =5449.334; df=1378; p<0.001.
                                 2
                 Abbreviations: CES: Corporate environmental strategy; ERA: Environmental related activities; INF: Environmental information;
                 PPC: Plastic pollution control.
                of factors. According to Shrestha  Cronbach’s alpha   0.6 and 0.8) and a corrected item-total correlation larger
                                               56
                measures a questionnaire’s reliability. It gives a   than 0.3 is regarded as trustworthy.  During this phase
                                                                                                   57
                straightforward  approach  to  determining  whether  a   of analysis and as illustrated in Table 3, the internal
                score is credible. It assumes several items measure   consistency of constructs (all relative) was examined,
                the  same underlying  notion.  Cronbach’s  alpha  is   and  composite  reliability  values  of  both  constructs
                a measurement of internal consistency. It is also   exceeded 0.70, which suggests moderate (acceptable)
                regarded as a metric of scale dependability. Cronbach’s   reliability CES and PPC scores of 0.719 and 0.869,
                alpha varies from 0 to 1. In general, Cronbach’s alpha   respectively.  The  next  phase  requires  establishing
                values >0.7 are regarded as acceptable. However,    the validity of each construct, which is indicated by
                other scholars have highlighted that an item with a   the variance, and as illustrated in Table 3 above, the
                Cronbach’s alpha score of >0.6 (acceptable between   variances have a value of 0.5 and higher. This indicates


                Volume 22 Issue 1 (2025)                        89                                 doi: 10.36922/ajwep.7089
   90   91   92   93   94   95   96   97   98   99   100