
Page 123 - AJWEP-v22i2
P. 123
Treated wastewater for concrete mixing
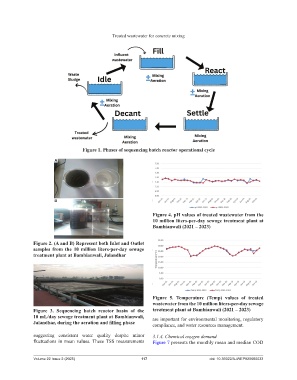
Figure 1. Phases of sequencing batch reactor operational cycle
A
B
Figure 4. pH values of treated wastewater from the
10 million liters-per-day sewage treatment plant at
Bambianwali (2021 – 2023)
Figure 2. (A and B) Represent both Inlet and Outlet
samples from the 10 million liters-per-day sewage
treatment plant at Bambianwali, Jalandhar
Figure 5. Temperature (Temp) values of treated
wastewater from the 10 million liters-per-day sewage
Figure 3. Sequencing batch reactor basin of the treatment plant at Bambianwali (2021 – 2023)
10 mL/day sewage treatment plant at Bambianwali, are important for environmental monitoring, regulatory
Jalandhar, during the aeration and filling phase compliance, and water resources management.
suggesting consistent water quality despite minor 3.1.4. Chemical oxygen demand
fluctuations in mean values. These TSS measurements Figure 7 presents the monthly mean and median COD
Volume 22 Issue 2 (2025) 117 doi: 10.36922/AJWEP025060033