
Page 124 - AJWEP-v22i2
P. 124
Vasudeva, et al.
levels in wastewater used for cement production and environmental management. These monthly data
from April 2021 to March 2022, in reference to water highlight seasonal trends in BOD and offer insights for
transport standards. The mean COD values consistently ongoing water quality monitoring and management.
ranged from 38 to 41 mg/L, indicating a stable central
tendency across most months. COD is an important 3.1.6. F. coli
parameter for assessing the concentration of organic Figure 9 summarizes the monthly F. coli counts from
pollutants in wastewater, particularly in evaluating April 2021 – March 2022, which are used to assess
its suitability for industrial reuse, such as cement water quality, particularly in relation to potable
production. Maintaining COD levels within regulatory water and public health standards. The mean F. coli
limits helps environmental degradation and ensures counts ranged from 542.5 colony-forming units
compliance with quality standards. The data reveal (CFU)/100 mL in December to 642.5 CFU/100 mL
monthly fluctuations in COD levels and serve as a basis in June, indicating seasonal variability in bacterial
for informed environmental management decisions. contamination. Median values followed a similar
trend, ranging from 540 CFU/100 mL in December to
3.1.5. BOD 645 CFU/100 mL in June. July recorded a median count
Figure 8 presents the monthly BOD values from of 595 CFU/100 mL, indicating heightened microbial
April 2021 – March 2022. BOD levels ranged from a presence during that period. F. coli levels are crucial
low of 7.0 mg/L in December to a high of 7.54 mg/L indicators of potential waterborne health risks and are
in October. Median BOD values remained relatively essential for environmental monitoring and regulatory
consistent between 7 mg/L and 8 mg/L across the study compliance. The data highlight monthly fluctuations
period, reflecting overall stability in organic pollutant in F. coli levels and inform public health interventions
load. July exhibited a median BOD of 8.0 mg/L, aimed at safeguarding water quality year-round.
indicating a typical seasonal peak. BOD is a key
indicator of organic contamination and plays a critical 3.1.7. Total Kjeldahl nitrogen (TKN)
role in evaluating water quality, regulatory compliance, Figure 10 presents the monthly concentrations of TKN
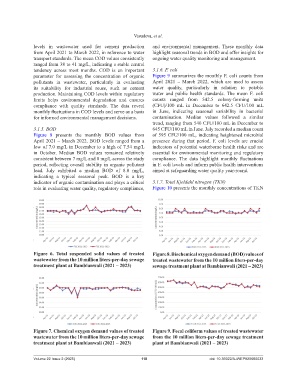
Figure 6. Total suspended solid values of treated Figure 8. Biochemical oxygen demand (BOD) values of
wastewater from the 10 million liters-per-day sewage treated wastewater from the 10 million liters-per-day
treatment plant at Bambianwali (2021 – 2023) sewage treatment plant at Bambianwali (2021 – 2023)
Figure 7. Chemical oxygen demand values of treated Figure 9. Fecal coliform values of treated wastewater
wastewater from the 10 million liters-per-day sewage from the 10 million liters-per-day sewage treatment
treatment plant at Bambianwali (2021 – 2023) plant at Bambianwali (2021 – 2023)
Volume 22 Issue 2 (2025) 118 doi: 10.36922/AJWEP025060033