
Page 125 - AJWEP-v22i2
P. 125
Treated wastewater for concrete mixing
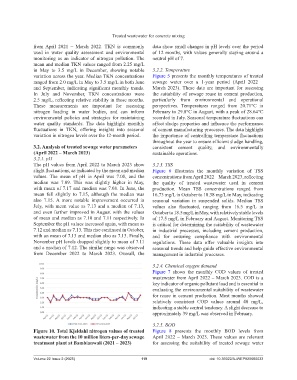
from April 2021 – March 2022. TKN is commonly data show small changes in pH levels over the period
used in water quality assessment and environmental of 12 months, with values generally staying around a
monitoring as an indicator of nitrogen pollution. The neutral pH of 7.
mean and median TKN values ranged from 2.25 mg/L
in May to 3.5 mg/L in December, showing notable 3.2.2. Temperature
variation across the year. Median TKN concentrations Figure 5 presents the monthly temperatures of treated
ranged from 2.0 mg/L in May to 3.5 mg/L in both June sewage water over a 1-year period (April 2022 –
and September, indicating significant monthly trends. March 2023). These data are important for assessing
In July and November, TKN concentrations were the suitability of sewage reuse in cement production,
2.5 mg/L, reflecting relative stability in those months. particularly from environmental and operational
These measurements are important for assessing perspectives. Temperatures ranged from 20.71°C in
nitrogen loading in water bodies, and can inform February to 29.8°C in August, with a peak of 28.64°C
environmental policies and strategies for maintaining recorded in July. Seasonal temperature fluctuations can
water quality standards. The data highlight monthly affect sludge properties and influence the performance
fluctuations in TKN, offering insights into seasonal of cement manufacturing processes. The data highlight
variation in nitrogen levels over the 12-month period. the importance of controlling temperature fluctuations
throughout the year to ensure efficient sludge handling,
3.2. Analysis of treated sewage water parameters consistent cement quality, and environmentally
(April 2022 – March 2023) sustainable operations.
3.2.1. pH
The pH values from April 2022 to March 2023 show 3.2.3. TSS
slight fluctuations, as indicated by the mean and median Figure 6 illustrates the monthly variation of TSS
values. The mean of pH in April was 7.08, and the concentrations from April 2022 – March 2023, reflecting
median was 7.09. This was slightly higher in May, the quality of treated wastewater used in cement
with mean of 7.17 and median was 7.08. In June, the production. Mean TSS concentrations ranged from
mean fell slightly to 7.15, although the median was 16.73 mg/L in October to 18.38 mg/L in May, indicating
also 7.15. A more notable improvement occurred in seasonal variation in suspended solids. Median TSS
July, with mean value as 7.13 and a median of 7.13, values also fluctuated, ranging from 16.5 mg/L in
and even further improved in August with the values October to 18.5 mg/L in May, with relatively stable levels
of mean and median as 7.10 and 7.11 respectively. In of 17.5 mg/L in February and August. Monitoring TSS
September the pH values increased again, with mean as is critical for determining the suitability of wastewater
7.12 and median as 7.13. This rise continued in October, in industrial processes, including cement production,
with an mean of 7.13 and median also as 7.13. Finally, and for ensuring compliance with environmental
November pH levels dropped slightly to mean of 7.11 regulations. These data offer valuable insights into
and a median of 7.12. The similar range was observed seasonal trends and help guide effective environmental
from December 2022 to March 2023. Overall, the management in industrial processes.
3.2.4. Chemical oxygen demand
Figure 7 shows the monthly COD values of treated
wastewater from April 2022 – March 2023. COD is a
key indicator of organic pollutant load and is essential in
evaluating the environmental suitability of wastewater
for reuse in cement production. Most months showed
relatively consistent COD values around 40 mg/L,
indicating a stable central tendency. A slight decrease to
approximately 39 mg/L was observed in February.
3.2.5. BOD
Figure 10. Total Kjeldahl nitrogen values of treated Figure 8 presents the monthly BOD levels from
wastewater from the 10 million liters-per-day sewage April 2022 – March 2023. These values are relevant
treatment plant at Bambianwali (2021 – 2023) for assessing the suitability of treated sewage water
Volume 22 Issue 2 (2025) 119 doi: 10.36922/AJWEP025060033