Page 128 - AJWEP-v22i2
P. 128

Vasudeva, et al.

                                                                     Table 2. Strength of concrete mixed with 100%
                                                                     potable water

                                                                     Characteristic strength     After         After
                                                                     of concrete (N/mm )        7 days        28 days
                                                                                     2
                                                                     Cube no. 1                  13.11         23.75
                                                                     Cube no. 2                  13.91         24.28
                                                                     Cube no. 3                  13.77         23.85


                Figure 11. Characteristic strength of concrete mixed   Table 3. Strength of concrete mixed with primary
                with 100% potable water                              treated wastewater and potable water (60:40
                                                                     ratio)
                                                                     Characteristic strength     After        After
                                                                     of concrete (N/mm )         7 days       28 days
                                                                                     2
                                                                     Cube no. 1                  13.77        17.00
                                                                     Cube no. 2                  13.77        17.22
                                                                     Cube no. 3                  13.44        17.66


                                                                     Table 4. Strength of concrete mixed with
                                                                     secondary treated wastewater and potable water
                                                                     (60:40 ratio)
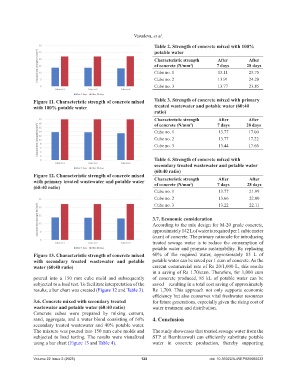
                Figure 12. Characteristic strength of concrete mixed
                with primary treated wastewater and potable water    Characteristic strength     After         After
                                                                                     2
                (60:40 ratio)                                        of concrete (N/mm )         7 days       28 days
                                                                     Cube no. 1                  13.77         21.99
                                                                     Cube no. 2                  13.66         22.00
                                                                     Cube no. 3                  13.22         22.11


                                                                    3.7. Economic consideration
                                                                    According to the mix design for M-20 grade concrete,
                                                                    approximately 142 L of water is required per 1 cubic meter
                                                                    (cum) of concrete. The primary rationale for introducing
                                                                    treated sewage water is to reduce the consumption of
                                                                    potable water and promote sustainability. By replacing
                Figure 13. Characteristic strength of concrete mixed   60% of the required water, approximately 85  L of
                with secondary treated wastewater and potable       potable water can be saved per 1 cum of concrete. As the
                water (60:40 ratio)                                 current commercial rate of Rs 20/1,000 L, this results
                                                                    in a saving of Rs 1.70/cum. Therefore, for 1,000 cum
                poured into a 150  mm cube mold and subsequently    of concrete produced, 85 kL of potable water can be
                subjected to a load test. To facilitate interpretation of the   saved – resulting in a total cost saving of approximately
                results, a bar chart was created (Figure 12 and Table 3).  Rs 1,700.  This approach not only supports economic
                                                                    efficiency but also conserves vital freshwater resources
                3.6. Concrete mixed with secondary treated          for future generations, especially given the rising cost of
                wastewater and potable water (60:40 ratio)          water treatment and distribution.
                Concrete  cubes  were  prepared  by mixing  cement,
                sand, aggregate, and a water blend consisting of 60%   4. Conclusion
                secondary treated wastewater and 40% potable water.
                The mixture was poured into 150 mm cube molds and   The study showcases that treated sewage water from the
                subjected  to load testing. The results were visualized   STP at Bambianwali can efficiently substitute potable
                using a bar chart (Figure 13 and Table 4).          water in concrete production, thereby supporting


                Volume 22 Issue 2 (2025)                       122                           doi: 10.36922/AJWEP025060033
   123   124   125   126   127   128   129   130   131   132   133