
Page 204 - AJWEP-v22i2
P. 204
Sefolo, et al.
interventions, and land use planning play key roles
in the number of residents and the vulnerability of
infrastructure to these hazards.
The simulation conducted in this study was able to
predict the situation over the next 10 years, considering
whether or not the climate change policy is implemented.
The simulation results indicated a significant
occurrence of extreme events, such as extreme
temperatures, droughts, rainfall fluctuations, and
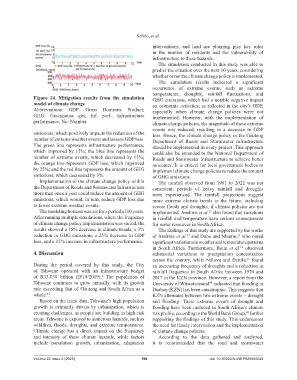
Figure 14. Mitigation results from the simulation GHG emissions, which had a notable negative impact
model of climate change on economic activities, as reflected in the city’s GDP,
Abbreviations: GDP: Gross Domestic Product; especially when climate change policies were not
GHG: Greenhouse gas; Inf. perf.: Infrastructure implemented. However, with the implementation of
performance; No: Number. climate change policies, the magnitude of these extreme
events was reduced, resulting in a decrease in GDP
emissions, which positively impacts the reduction of the loss. Hence, the climate change policy in the Gauteng
number of extreme weather events and lessens GDP loss. Department of Roads and Stormwater Infrastructure
The green line represents infrastructure performance, should be implemented in every project. This approach
which improved by 15%; the blue line represents the could also be extended to the National Department of
number of extreme events, which decreased by 15%; Roads and Stormwater Infrastructure to achieve better
the orange line represents GDP loss, which improved outcomes. It is critical for local government bodies to
by 25%; and the red line represents the amount of GHG implement climate change policies to reduce the amount
emissions, which decreased by 3%. of GHG emissions.
Implementation of the climate change policy within The rainfall observed from 1981 to 2022 was not
the Department of Roads and Stormwater Infrastructure consistent; periods of heavy rainfall and droughts
more than once a year could reduce the amount of GHG were experienced. The rainfall projections suggest
emissions, which would, in turn, reduce GDP loss due more extreme climate trends in the future, including
to fewer extreme weather events. severe floods and droughts, if climate policies are not
The modeling horizon was set for a period of 10 years. implemented. Anekwe et al. also found that variations
12
After running multiple simulations, where the frequency in rainfall and temperature have serious consequences
of climate change policy implementation was varied, the for water resources in South Africa.
results showed a 15% decrease in climate trends, a 3% The findings of this study are supported by the works
reduction in GHG emissions, a 25% decrease in GDP of Anekwe et al. and Dube and Nhamo, who noted
11
12
loss, and a 15% increase in infrastructure performance. significant variations in weather and temperature patterns
in South Africa. Furthermore, Botai et al. observed
14
4. Discussion substantial variations in precipitation concentration
across the country, while Ndlovu and Demlie found
16
During the period covered by this study, the City an increasing frequency of droughts and a reduction in
of Tshwane operated with an infrastructure budget rainfall frequency in South Africa between 1970 and
of R33.038 billion (2018/2019). The population of 2017 in the KZN province. However, a report from the
2
Tshwane continues to grow annually, with its growth University of Witwatersrand indicated that flooding in
48
rate exceeding that of Gauteng and South Africa as a Durban (KZN) has been catastrophic. This suggests that
whole. 47 KZN alternates between two extreme events – drought
Based on the latest data, Tshwane’s high population and flooding. These extreme events of drought and
growth is primarily driven by urbanization, which is flooding have been included in South Africa’s climate
creating challenges, as people are building in high-risk risk profile, according to the World Bank Group, further
49
areas. Tshwane is exposed to numerous hazards, such as supporting the findings of this study. This underscores
wildfires, floods, droughts, and extreme temperatures. the need for timely intervention and the implementation
Climate change has a direct impact on the frequency of climate change policies.
and intensity of these climate hazards, while factors According to the data gathered and analyzed,
include population growth, urbanization, adaptation it is recommended that the road and stormwater
Volume 22 Issue 2 (2025) 198 doi: 10.36922/AJWEP025080049