
Page 202 - AJWEP-v22i2
P. 202
Sefolo, et al.
of statistically significant differences or variations Ait
between the groups. This finding is an indication that Ait git δ Tit δ1 2 Rit δ SPTit δ3 4 SPRit (V)
notable changes in temperature and rainfall patterns
occurred during the study period, likely as a result of where T is temperature, R represents rainfall, and the
climate change. spatial effect terms (standard penetration test [SPT] and
soil penetration resistance [SPR]) affect total factors
3.3. Annual rainfall in the City of Tshwane and productivity exponentially.
As shown in Figure 4 in Section 2.4 (rainfall data from From Equation V, two key parameters that directly
1981 to 2022 in the City of Tshwane), rainfall has not influence climate change – namely, temperature and
been uniform, leading to periods of droughts and floods. rainfall – are included in the economic modeling
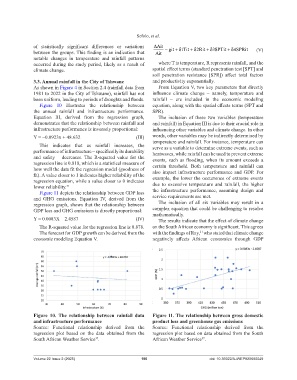
Figure 10 illustrates the relationship between equation, along with the spatial effects terms (SPT and
the annual rainfall and infrastructure performance. SPR).
Equation III, derived from the regression graph, The inclusion of these two variables (temperature
demonstrates that the relationship between rainfall and and rainfall) in Equation III is due to their crucial role in
infrastructure performance is inversely proportional: influencing other variables and climate change. In other
Y = −0.0923x + 48.632 (III) words, other variables may be indirectly determined by
This indicates that as rainfall increases, the temperature and rainfall. For instance, temperature can
serve as a variable to determine extreme events, such as
performance of infrastructure – specifically its durability heatwaves, while rainfall can be used to prevent extreme
and safety – decreases. The R-squared value for the events, such as flooding, when its amount exceeds a
regression line is 0.818, which is a statistical measure of certain threshold. Both temperature and rainfall can
how well the data fit the regression model (goodness of
fit). A value closer to 1 indicates higher reliability of the also impact infrastructure performance and GDP. For
regression equation, while a value closer to 0 indicates example, the lower the occurrence of extreme events
lower reliability. 31 due to excessive temperature and rainfall, the higher
Figure 11 depicts the relationship between GDP loss the infrastructure performance, assuming design and
and GHG emissions. Equation IV, derived from the service requirements are met.
regression graph, shows that the relationship between The inclusion of all six variables may result in a
GDP loss and GHG emissions is directly proportional: complex equation that could be challenging to resolve
mathematically.
Y = 0.0083X – 2.4587 (IV) The results indicate that the effect of climate change
The R-squared value for the regression line is 0.878. on the South African economy is significant. This agrees
The forecast for GDP growth can be derived from the with the findings of Ray, who stated that climate change
21
economic modeling Equation V. negatively affects African economies through GDP
Figure 10. The relationship between rainfall data Figure 11. The relationship between gross domestic
and infrastructure performance product loss and greenhouse gas emissions
Source: Functional relationship derived from the Source: Functional relationship derived from the
regression plot based on the data obtained from the regression plot based on data obtained from the South
South African Weather Service . African Weather Service .
37
37
Volume 22 Issue 2 (2025) 196 doi: 10.36922/AJWEP025080049