
Page 200 - AJWEP-v22i2
P. 200
Sefolo, et al.
(i) Discrete-time: The DES assumes that time the system’s behavior unless they are explicitly
progresses in discrete steps, with events occurring included in the model.
at specific points in time.
(ii) State change: The DES assumes that the system’s 3. Results and discussion
state changes dynamically as events occur, and the
system behavior is primarily driven by events. 3.1. Evaluation of bias in datasets
(iii) Stochastic behavior: The DES model also assumes Harman’s one-factor test was conducted to evaluate
that the time between events, as well as the behavior the presence of common bias. For the climate change
of entities and resources, are subjected to random dataset, the total variance extracted was 6.253, with the
variability. corresponding sum of squares accounting for 31.835%
(iv) Aggregation: One of the assumptions in the SD of the variance. Similarly, the financial dataset showed
model is that extreme events – including excessive a total extraction of 6.850 and a sum of squares of
temperature, flooding, and drought – are modeled 34.122%.
as a single event or entity. This approach reduces According to the rule of thumb, if the total variance
the complexity of the model and reflects the extracted by one factor exceeds 50%, common method
interrelated nature of these variables. For instance, bias may be present. In this study, there is no evidence of
temperature can influence precipitation patterns, such bias for both the rainfall and temperature datasets,
leading to either heavy rainfall (and flooding) or as the total variance explained by one factor is below
drought. High temperatures may increase the rate of the 50% threshold—31.835% for rainfall and 34.122%
evaporation, causing dry conditions and droughts, for temperature. 31
while also increasing the amount of atmospheric
water vapor, which can intensify precipitation 3.2. Descriptive statistics and analysis of variance
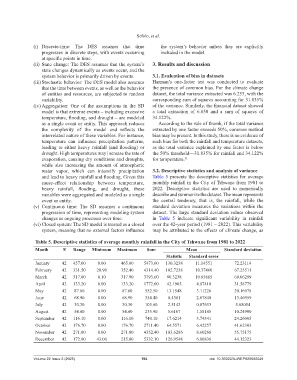
and lead to heavy rainfall and flooding. Given this Table 5 presents the descriptive statistics for average
cause-effect relationship between temperature, monthly rainfall in the City of Tshwane from 1981 to
heavy rainfall, flooding, and drought, these 2022. Descriptive statistics are used to numerically
variables were aggregated and modeled as a single describe and summarize the dataset. The mean represents
event or entity. the central tendency, that is, the rainfall, while the
(v) Continuous time: The SD assumes a continuous standard deviation measures the variations within the
progression of time, representing modeling system dataset. The large standard deviation values observed
changes as ongoing processes over time. in Table 5 indicate significant variability in rainfall
(vi) Closed system: The SD model is treated as a closed over the 42-year period (1981 – 2022). This variability
system, meaning that no external factors influence may be attributed to the effects of climate change, as
Table 5. Descriptive statistics of average monthly rainfall in the City of Tshwane from 1981 to 2022
Month N Range Minimum Maximum Sum Mean Standard deviation
Statistic Standard error
January 42 457.00 8.00 465.00 5473.60 130.3238 11.14551 72.23114
February 42 331.50 20.90 352.40 4314.40 102.7238 10.37460 67.23511
March 42 317.80 0.10 317.90 3793.60 90.3238 10.65665 69.06299
April 42 133.20 0.00 133.20 1772.00 42.1905 4.87410 31.58779
May 42 87.60 0.00 87.60 552.50 13.1548 3.11226 20.16978
June 42 68.90 0.00 68.90 354.40 8.4381 2.07840 13.46959
July 42 30.30 0.00 30.30 105.60 2.5143 0.87653 5.68054
August 42 54.40 0.00 54.40 235.90 5.6167 1.58145 10.24900
September 42 116.10 0.00 116.10 740.10 17.6214 3.74341 24.26005
October 42 176.70 0.00 176.70 2711.40 64.5571 6.42257 41.62303
November 42 271.80 0.00 271.80 4352.40 103.6286 8.60268 55.75175
December 42 172.80 43.00 215.80 5332.10 126.9548 6.80836 44.12323
Volume 22 Issue 2 (2025) 194 doi: 10.36922/AJWEP025080049