Page 196 - AJWEP-v22i2
P. 196

Sefolo, et al.

                country is relatively dry, with an annual average rainfall   average, characterized by a reduction in soil moisture
                of about  464  mm,  compared  to  the  global  average   and groundwater levels.
                rainfall of 990 mm. In addition, according to Writer,  a
                                                              43
                drought in South Africa is defined as a period when an   2.5. Analysis, modeling, and simulation of the
                area experiences precipitation or rainfall lower than the   datasets
                                                                    The data were analyzed descriptively as follows:
                                                                    (i)  Creating themes such as “evaluation of bias in the
                                                                        dataset,” “annual rainfall in the City of Tshwane,”
                                                                        and “modeling and simulation of the climate change
                                                                        and the mitigation strategy,” and categorizing data
                                                                        accordingly.
                                                                    (ii)  Elaborating  on  the  meaning  and  significance  of
                                                                        these themes as they relate to climate change and its
                                                                        effect on road and stormwater infrastructure in the
                                                                        City of Tshwane.
                                                                    (iii) Using graphs and plots, such as regression plots, pie
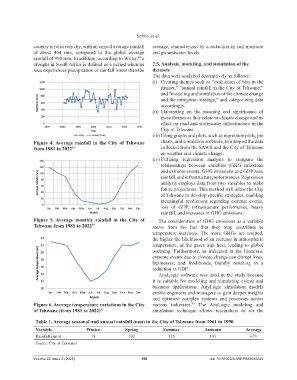
                Figure  4. Average rainfall in the City of  Tshwane     charts, and simulation software, to interpret the data
                from 1981 to 2022 37                                    collected from the SAWS and the City of Tshwane
                                                                        on weather and climate change.
                                                                    (iv) Utilizing  regression analysis to compare  the
                                                                        relationships  between  variables  (GHG emissions
                                                                        and extreme events, GHG emissions and GDP loss,
                                                                        rainfall, and infrastructure performance). Regression
                                                                        analysis employs data from two variables to make
                                                                        future projections. This method will allow the City
                                                                        of Tshwane to develop specific strategies, enabling
                                                                        meaningful  predictions  regarding extreme  events,
                                                                        loss of GDP, infrastructure  performance,  heavy
                                                                        rainfall, and increases in GHG emissions.
                Figure  5. Average monthly rainfall in the City of     The consideration of GHG emissions as a variable
                Tshwane from 1981 to 2022 37                        stems from the  fact  that  they  may  contribute  to
                                                                    temperature  increases.  The  more  GHGs are  emitted,
                                                                    the higher the likelihood of an increase in atmospheric
                                                                    temperature,  as the gases trap heat, leading to global
                                                                    warming. Furthermore, as indicated  in the literature,
                                                                    extreme events due to climate change can disrupt lives,
                                                                    businesses, and livelihoods, thereby resulting in a
                                                                    reduction in GDP.
                                                                       AnyLogic software was used in the study because
                                                                    it  is suitable for modeling  and simulating  events  and
                                                                    business applications.  AnyLogic simulation  models
                                                                    enable engineers and managers to gain deeper insights
                                                                    and optimize  complex  systems and processes across
                Figure 6. Average temperature variations in the City   various  industries.   The  AnyLogic  modeling  and
                                                                                     44
                of Tshwane (from 1981 to 2022) 37                   simulation  technique  allows researchers  to  set  the

                 Table 1. Average seasonal and annual rainfall (mm) in the City of Tshwane from 1961 to 1990

                 Variable              Winter           Spring           Summer            Autumn            Average
                 Rainfall (mm)           13              192               325               141               671
                 Source: City of Tshwane .
                                  2


                Volume 22 Issue 2 (2025)                       190                           doi: 10.36922/AJWEP025080049
   191   192   193   194   195   196   197   198   199   200   201