
Page 201 - AJWEP-v22i2
P. 201
Mitigating climate change in city of Tshwane
Table 6. Descriptive statistics of average yearly temperature in the City of Tshwane from 1981 to 2022
Variable N Range Minimum Maximum Sum Mean Standard deviation
Statistic Standard error
Rainfall 42 53.13 28.32 81.44 2439.84 58.0915 1.85334 12.01104
Table 7. Confidence interval and component variance for rainfall
Model Standard Standard 95% confidence interval for mean Between‑component
deviation error Lower bound Upper bound variance
Fixed effects 6.10233 1.76159 35.5685 80.3348 -
Random effects - 15.25579 23.9596 91.9437 2361.97017
Table 8. Analysis of variance results for rainfall
Comparison Sum of squares df Mean square F Significance
Between groups 25960.395 10 2596.039 69.714 0.023
Within groups 37.238 1 37.238 - -
Total 25997.633 11 - - -
it suggests significant fluctuations in monthly rainfall
patterns over time.
Table 6 presents the descriptive statistics of
average yearly temperature in the City of Tshwane
from 1981 to 2022. The large standard deviation
value (12.01104), indicates significant variations in
the dataset. This finding further implies significant
variation in the amount of rainfall over the 42-year
period (1981 – 2022), which may be attributed to the
effect of climate change.
A one-way analysis of variance was conducted
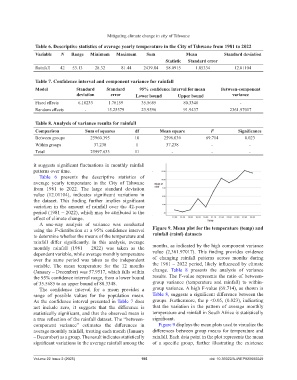
using the F-distribution at a 95% confidence interval Figure 9. Mean plot for the temperature (temp) and
to determine whether the means of the temperature and rainfall (rainf) datasets
rainfall differ significantly. In this analysis, average
monthly rainfall (1981 – 2022) was taken as the months, as indicated by the high component variance
dependent variable, while average monthly temperature value (2,361.97017). This finding provides evidence
over the same period was taken as the independent of changing rainfall patterns across months during
variable. The mean temperature for the 12 months the 1981 – 2022 period, likely influenced by climate
(January – December) was 57.9517, which falls within change. Table 8 presents the analysis of variance
the 95% confidence interval range, from a lower bound results. The F-value represents the ratio of between-
of 35.5685 to an upper bound of 80.3348. group variance (temperature and rainfall) to within-
The confidence interval for a mean provides a group variance. A high F-value (69.714), as shown in
range of possible values for the population mean. Table 8, suggests a significant difference between the
As the confidence interval presented in Table 7 does groups. Furthermore, the p <0.05, (0.023), indicating
not include zero, it suggests that the difference is that the variation in the pattern of average monthly
statistically significant, and that the observed mean is temperature and rainfall in South Africa is statistically
a true reflection of the rainfall dataset. The “between- significant.
component variance” estimates the differences in Figure 9 displays the mean plots used to visualize the
average monthly rainfall, treating each month (January differences between group means for temperature and
– December) as a group. The result indicates statistically rainfall. Each data point in the plot represents the mean
significant variations in the average rainfall among the of a specific group, further illustrating the existence
Volume 22 Issue 2 (2025) 195 doi: 10.36922/AJWEP025080049